Introduction
Observability is a key pillar in Site Reliability Engineering (SRE) that involves monitoring systems, identifying anomalies, troubleshooting issues, and ensuring seamless operations of services. SREs strive to maintain a balance between deploying new features rapidly and maintaining system reliability. To achieve this, observability tools help gather data, metrics, and logs from different layers of the system.
Observability includes metrics, logging, and tracing to provide deep insights into application health and performance. One of the robust tools for achieving this in the AWS cloud environment is OpenSearch (formerly Elasticsearch Service). AWS OpenSearch is an analytics suite that includes a search engine, a data visualization tool (Kibana, rebranded as OpenSearch Dashboards), and a RESTful API for ingesting, searching, and analyzing data. SREs can use AWS OpenSearch to centralize their logs, metrics, and traces for an integrated observability solution.
Why Use AWS OpenSearch for Observability?
- Centralized Log Management: OpenSearch allows the collection and centralization of logs from multiple sources, making it easy to search and analyze data for troubleshooting.
- Real-time Analytics: Ingest data in near-real-time to monitor system performance and identify issues quickly.
- Scalability: OpenSearch is fully managed on AWS, scaling to handle large volumes of data from diverse sources.
- Visualization: OpenSearch Dashboards provide powerful visualization capabilities for creating graphs, charts, and dashboards, offering an intuitive way to interpret data.
Setting Up AWS OpenSearch to Ingest VPC Flow Logs
In this blog, I will explore how AWS OpenSearch can enhance observability by ingesting VPC Flow Logs. VPC Flow Logs provide network traffic insights within your AWS environment, making them a crucial data source to monitor security and network performance.
Step 1: Set Up an AWS OpenSearch Domain
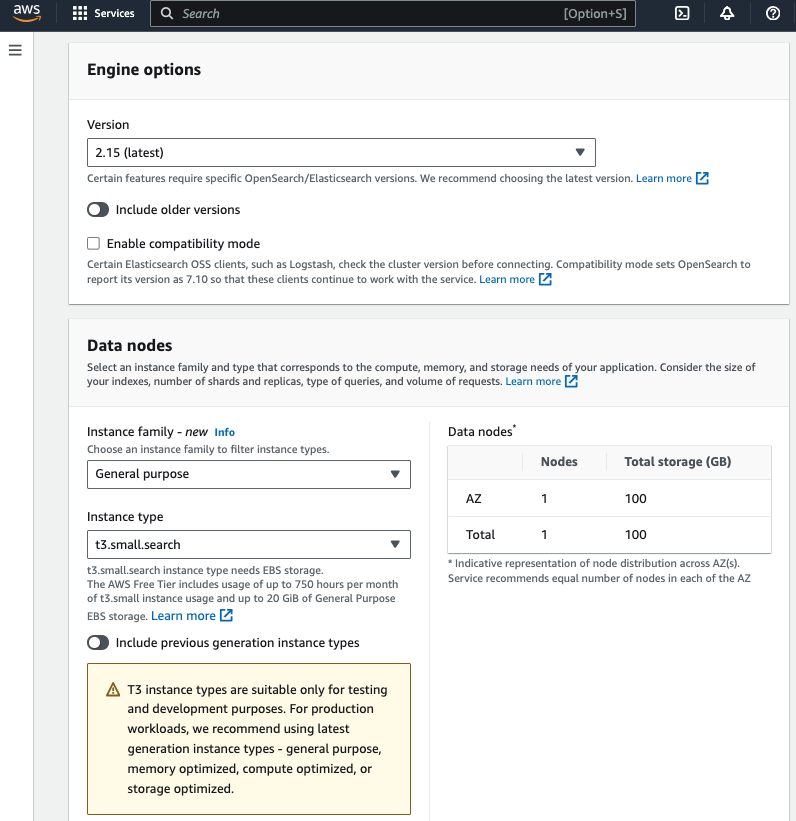
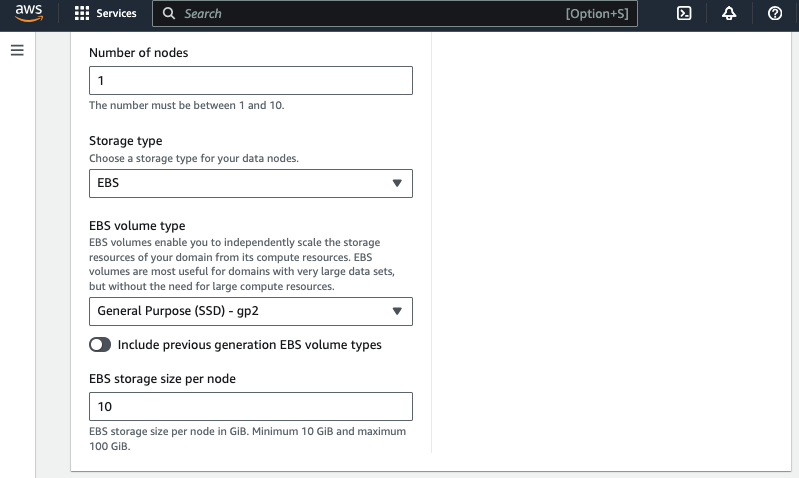
For the purpose of evaluation, I will create a single node domain using t3.small.search instance with 10GB EBS storage that is within the AWS free tier.
- Create an OpenSearch Domain:
- Go to the AWS Management Console
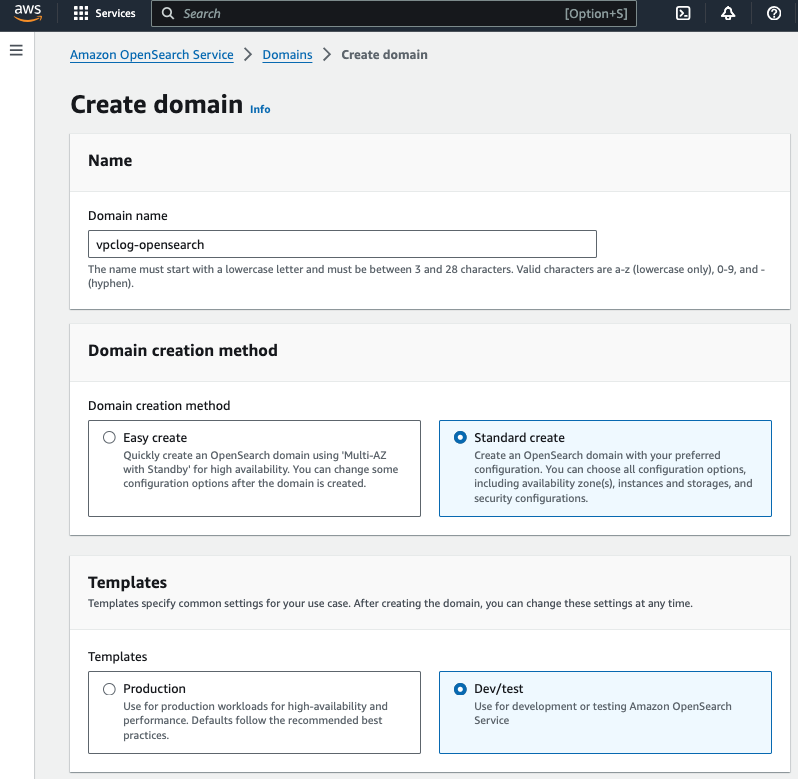
- Navigate to OpenSearch Service and click on Create domain
- Choose Standard create for Domain creation method
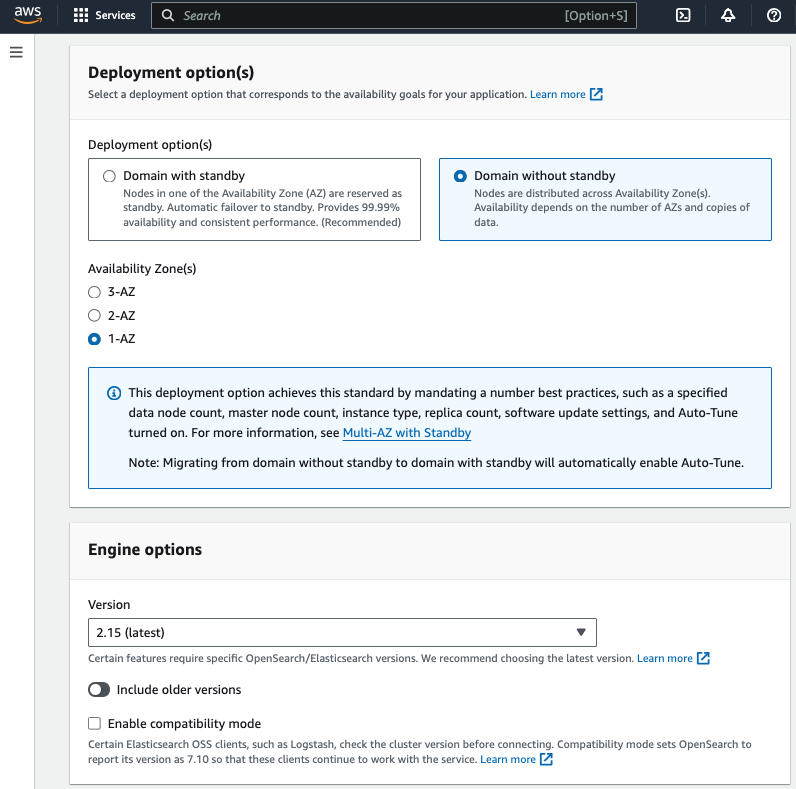
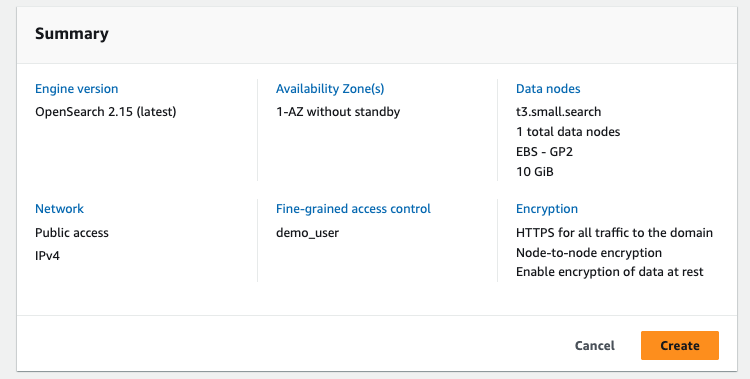
- Choose Dev/test for Templates and Domain without standby for Deployment option
- Choose 1-AZ for Availability Zone(s)
- Choose OpenSearch 2.15 (latest) for Version
- Select t3.small.search as instance type, 1 node and 10GiB EBS storage size per node
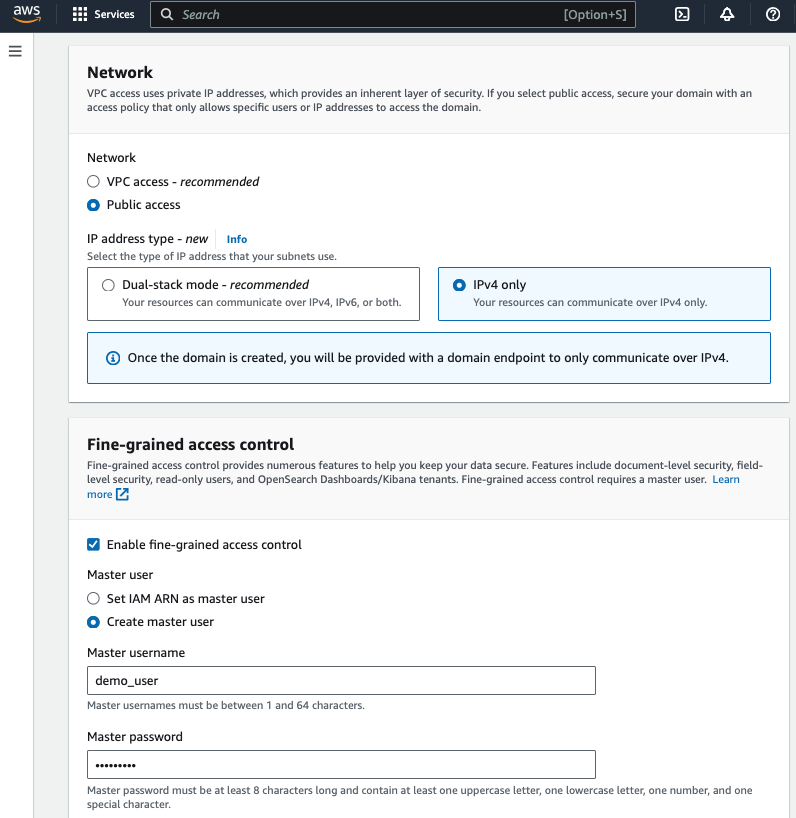
- Select Pubic access and IPv4 only for Network
- Create master user and choose your own Master username and Master password
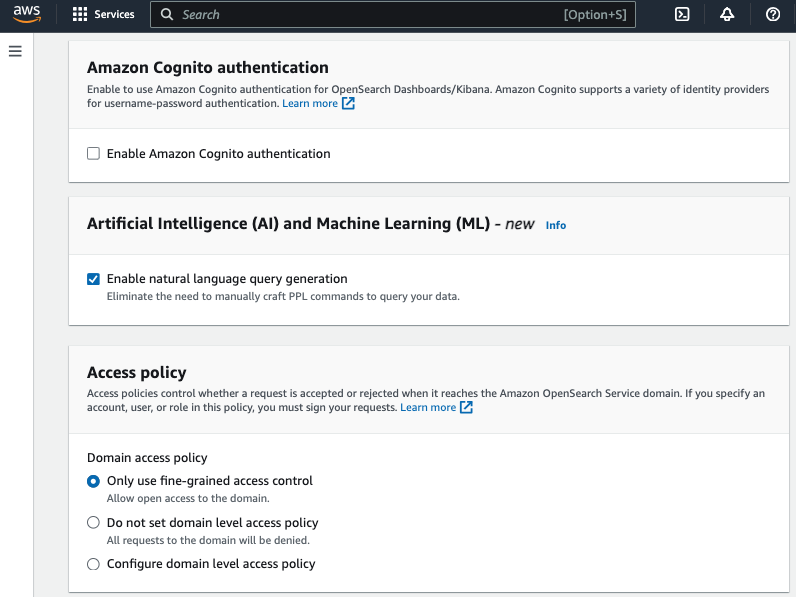
- For Access policy, choose Only use fine-grained access control to allow open access to the domain
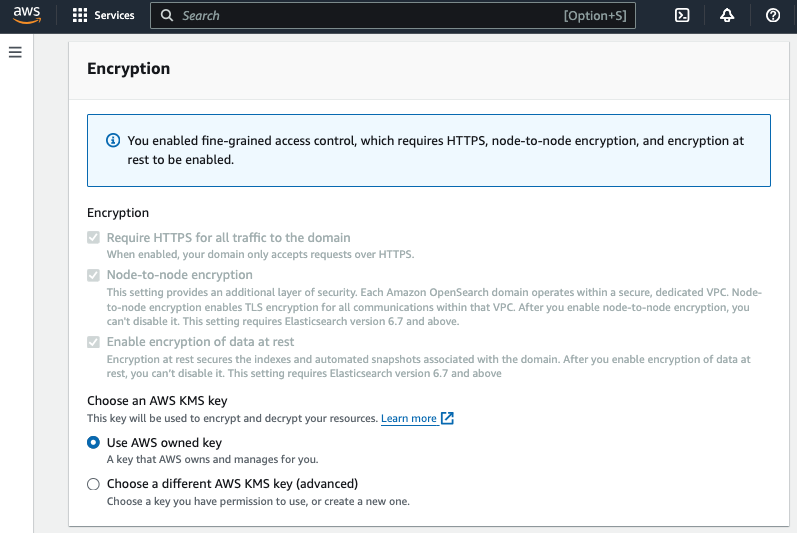
- For Encryption, choose Use AWS owned key
Step 2: Create CloudWatch Log Group
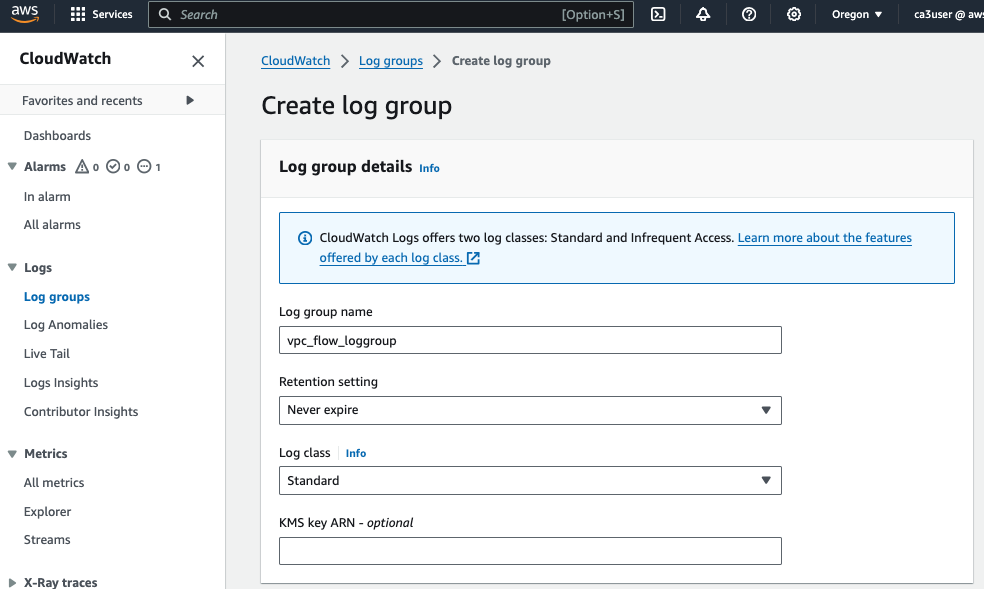
Create a new log group (vpc_flow_loggroup) in CloudWatch Logs to receive the VPC Flow Logs.
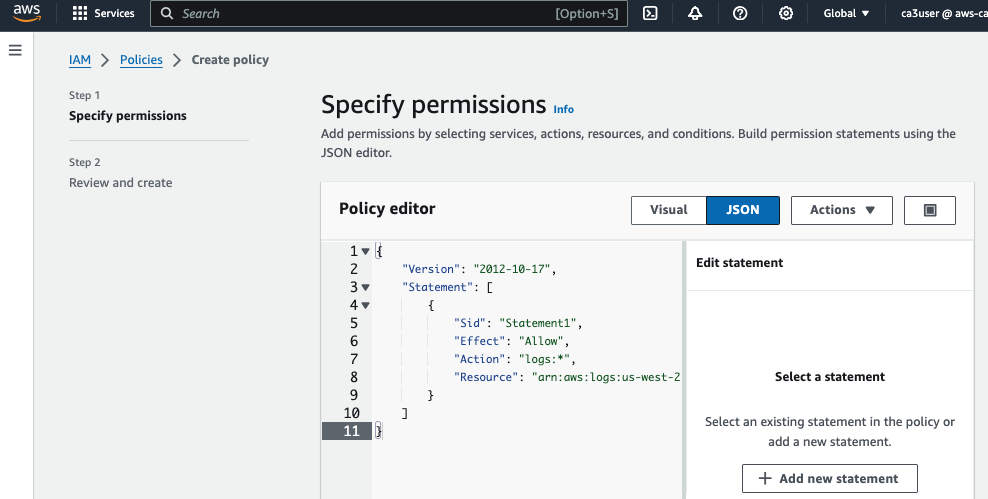
Create a IAM policy (MyVPCFlowLogtoCloudWatchPermission) with the following permission to write to the CloudWatch log group
{
	"Version": "2012-10-17",
	"Statement": [
		{
			"Sid": "Statement1",
			"Effect": "Allow",
			"Action": "logs:*",
			"Resource": "arn:aws:logs:us-west-2:<account id>:log-group:vpc_flow_loggroup:*"
		}
	]
}
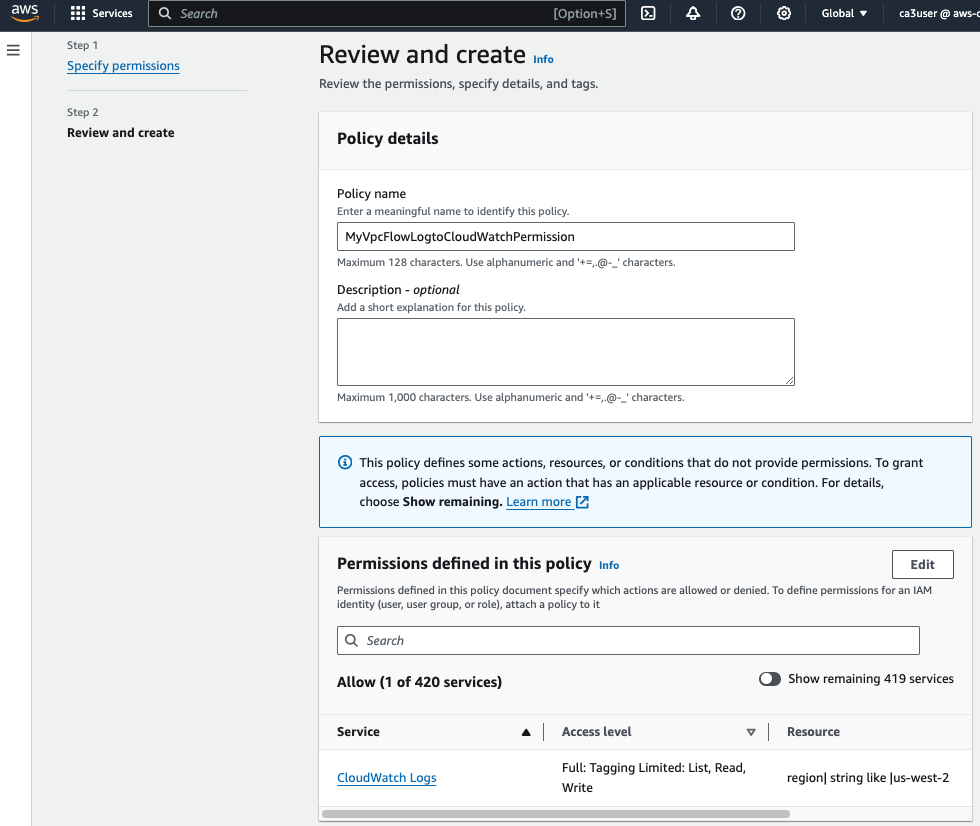
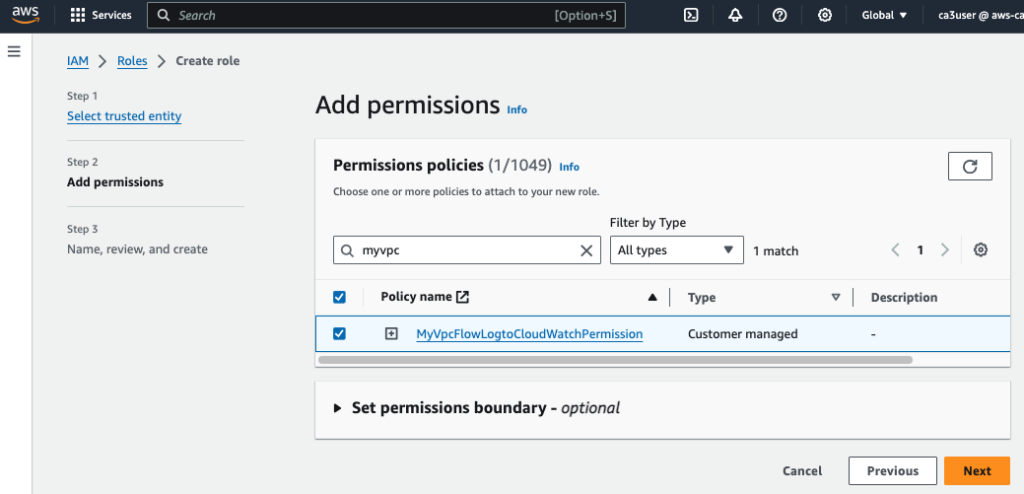
Create an IAM Role (MyVPCFlowLogRole) and attach the new policy to it.
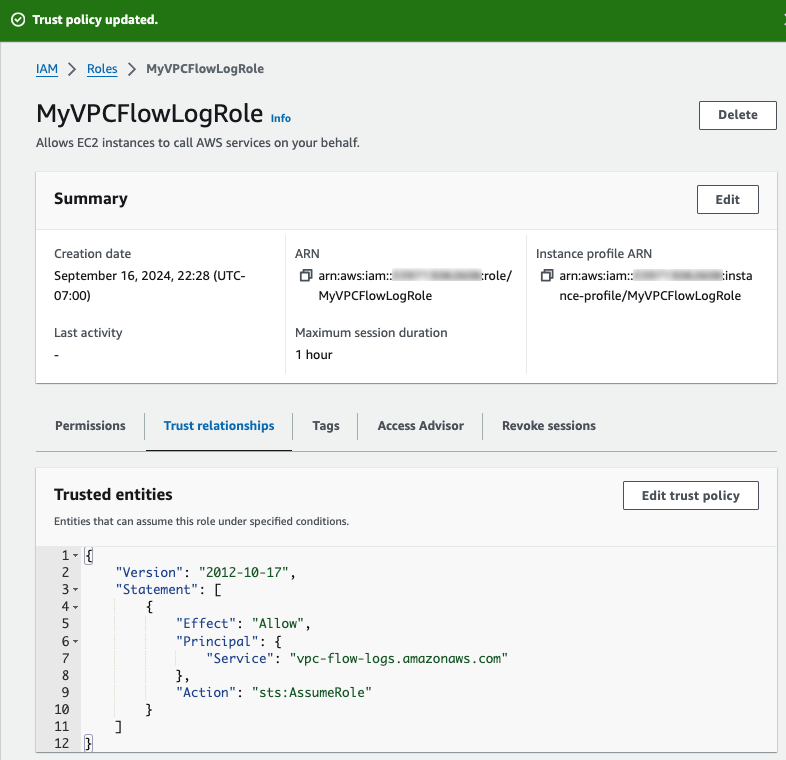
After the IAM role is created, edit the Trust relationship and change the service to vpc-flow-logs.amazonaws.com
Step 3: Enable VPC Flow Log
Go to VPC in AWS Management Console and select your VPC. Select Flow logs and choose Create flow log.
Choose All For Filter to have all traffic logged in CloudWatch for our analysis.
For Maximum aggregation interval, I will choose 1 minute to produce a higher volume of flow logs records.
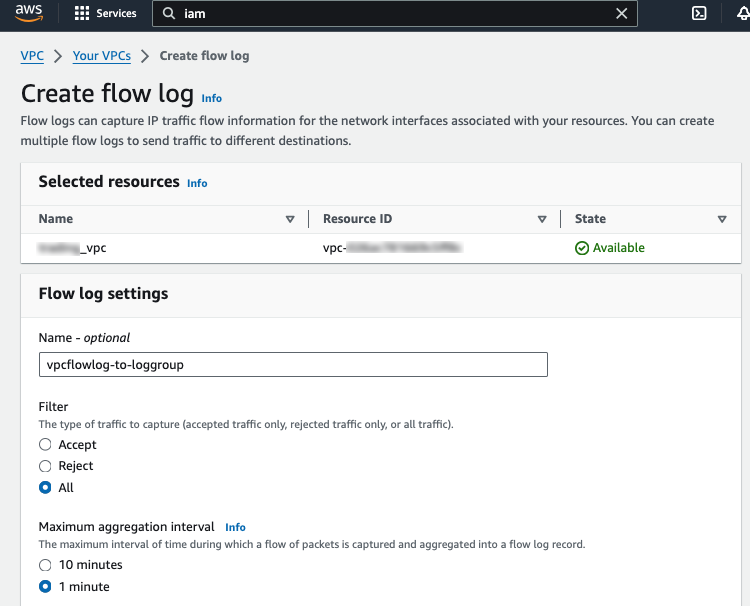
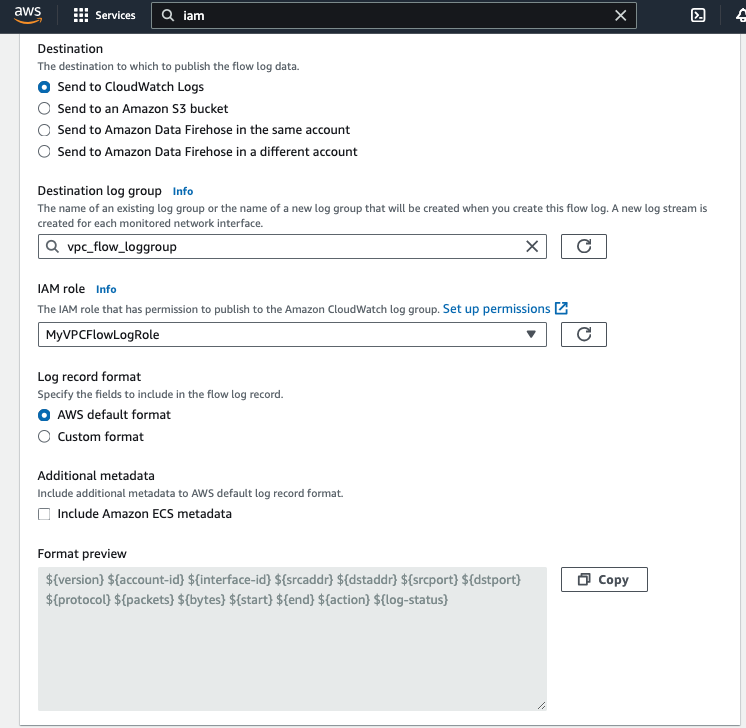
For Destination, choose Send to CloudWatch Logs and choose the vpc_flow_loggroup that we just created.
For IAM role, choose the IAM role (MyVPCFLowLogRole) we created in previous step.
For Log record format, choose AWS default format.
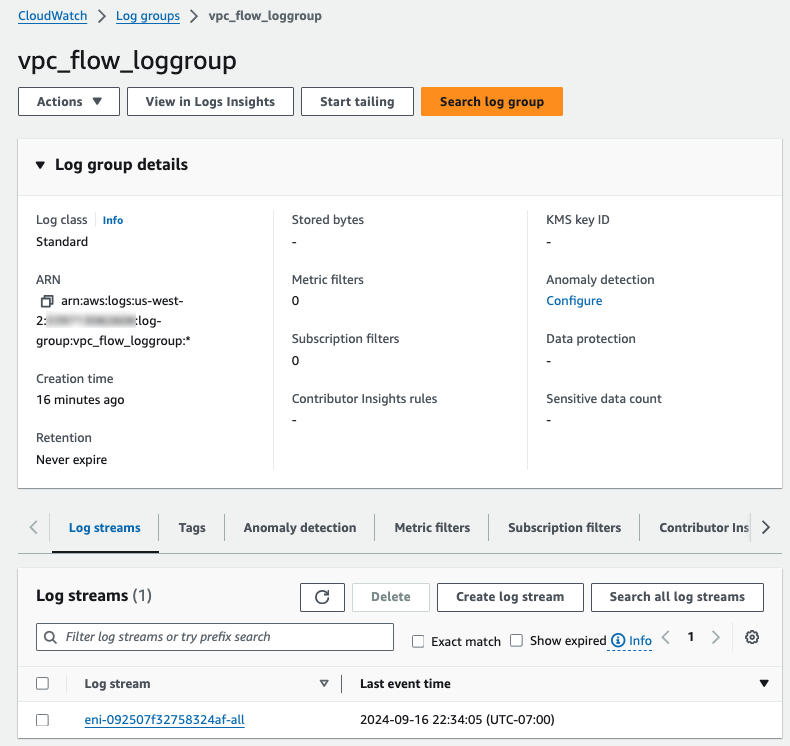
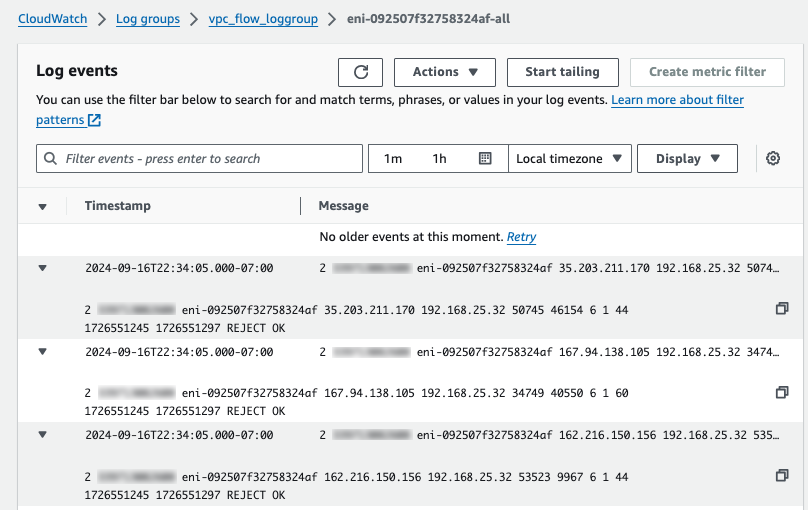
To verify our vpc flow log is sending log records, go to CloudWatch and check that new Log streams are created under the new vpc flow log group.
Step 4: Ingest CloudWatch Logs into OpenSearch Using Subscription Filter
When it comes to ingesting CloudWatch Logs into OpenSearch, there are two main approaches: Amazon Data Firehose streams and CloudWatch Logs subscription filter. Data Firehose streams offers powerful data transformation capabilities with built-in error handling, automated scaling and backups to Amazon S3. This is ideal for complex, high-throughput log processing. On the other hand, CloudWatch Logs subscription filters provide a simpler and more cost-effective way to forward logs directly to OpenSearch while allowing pattern-based filtering at the source.
For this blog, I will focus on using CloudWatch Logs subscription filters to streamline log ingestion and analysis in OpenSearch.
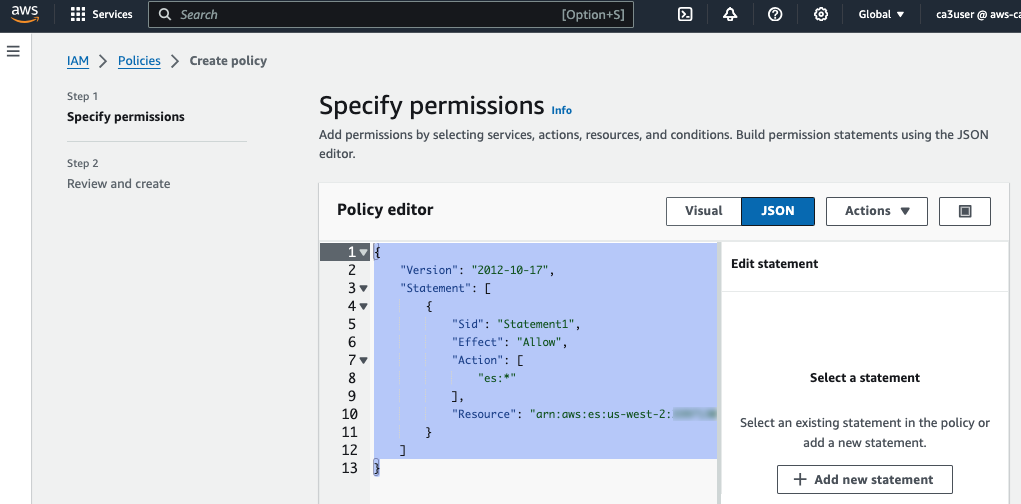
First we need an IAM role with permission to write to OpenSearch cluster. Go to IAM console, create a policy with the following permission and replace the ARN with your own OpenSearch domain ARN.
{
	"Version": "2012-10-17",
	"Statement": [
		{
			"Sid": "Statement1",
			"Effect": "Allow",
			"Action": [
				"es:*"
			],
			"Resource": "arn:aws:es:us-west-2:<account id>:domain/vpclog-opensearch"
		}
	]
}
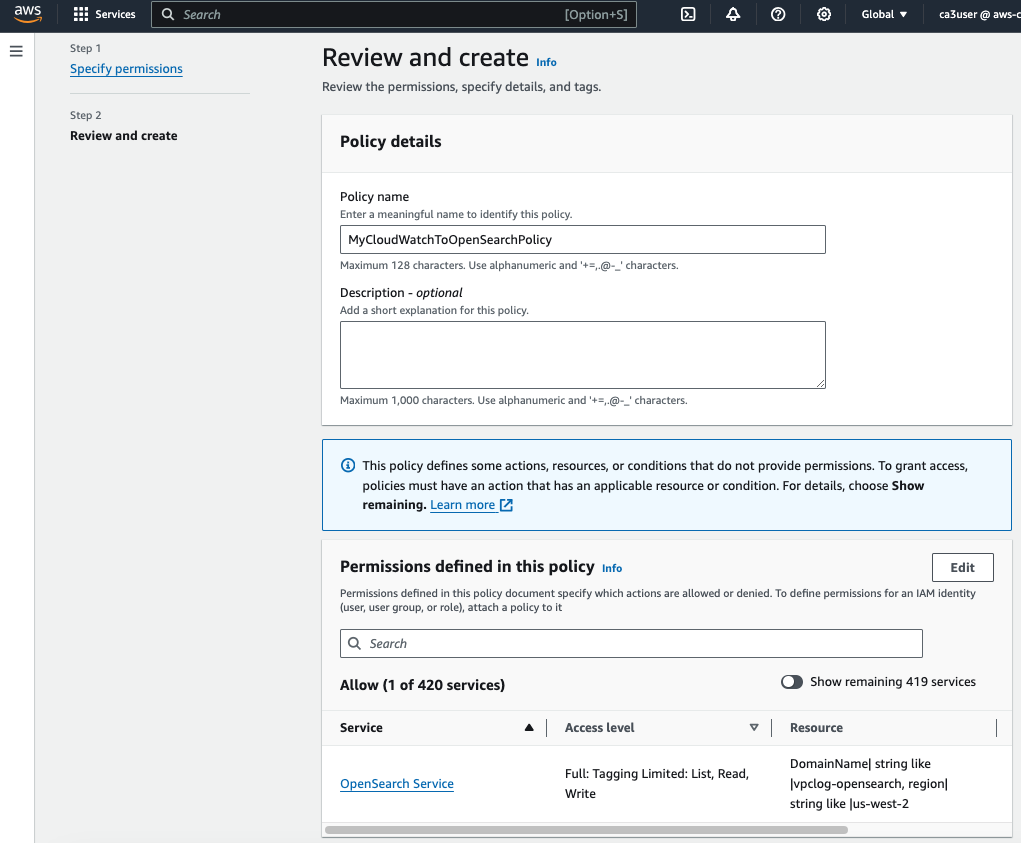
Now, create a new IAM role (MyCloudWatchToOSRole) and attach this new policy.
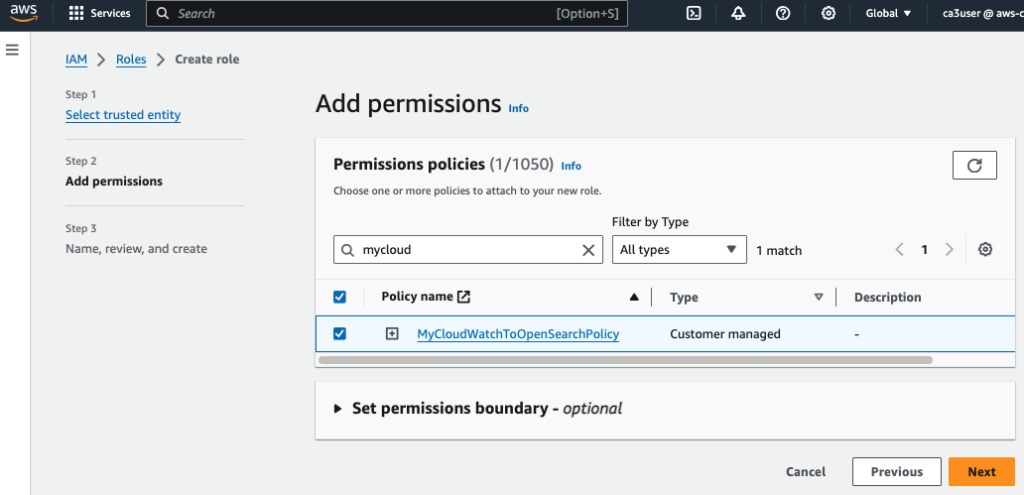
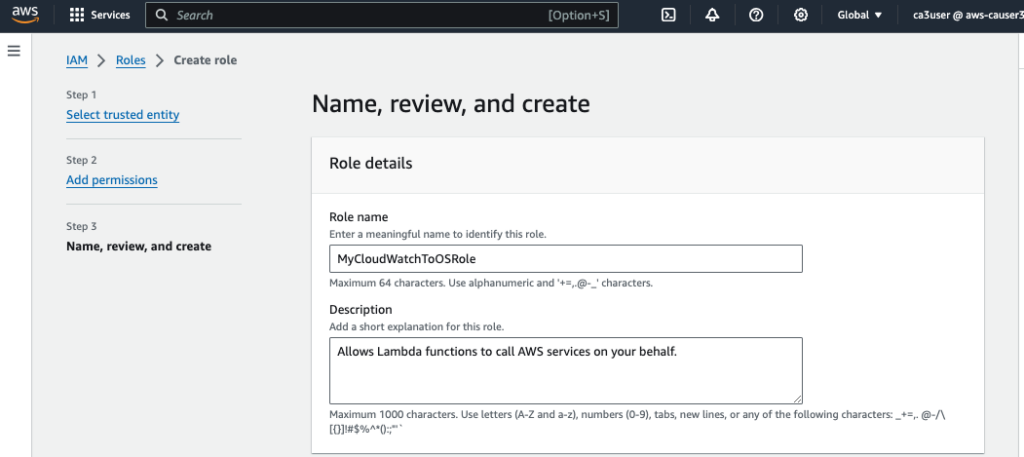
Go to CloudWatch in AWS Management Console, choose the vpc flow log group and create a Amazon OpenSearch Service Subscription Filter.
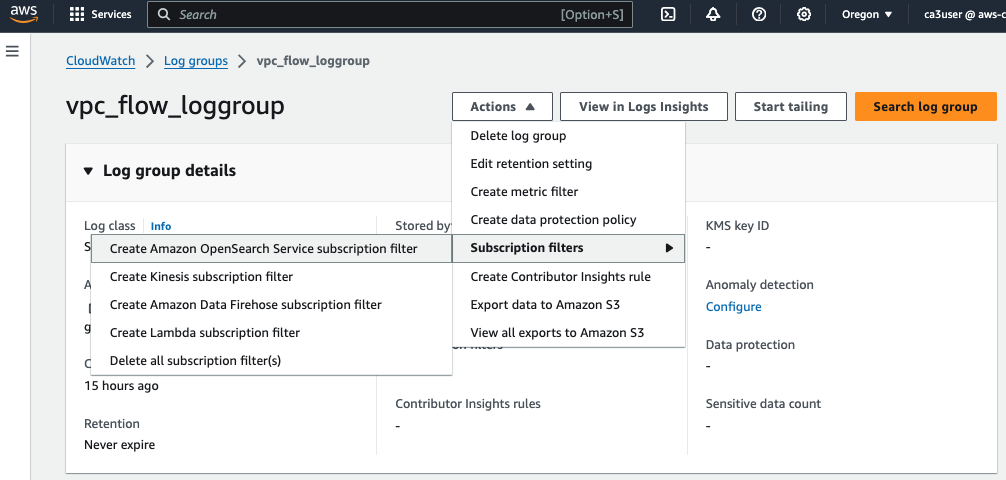
For Lambda IAM Execution Role, choose the IAM role (MyCloudWatchToOSRole) we created for writing the log to our OpenSearch cluster.
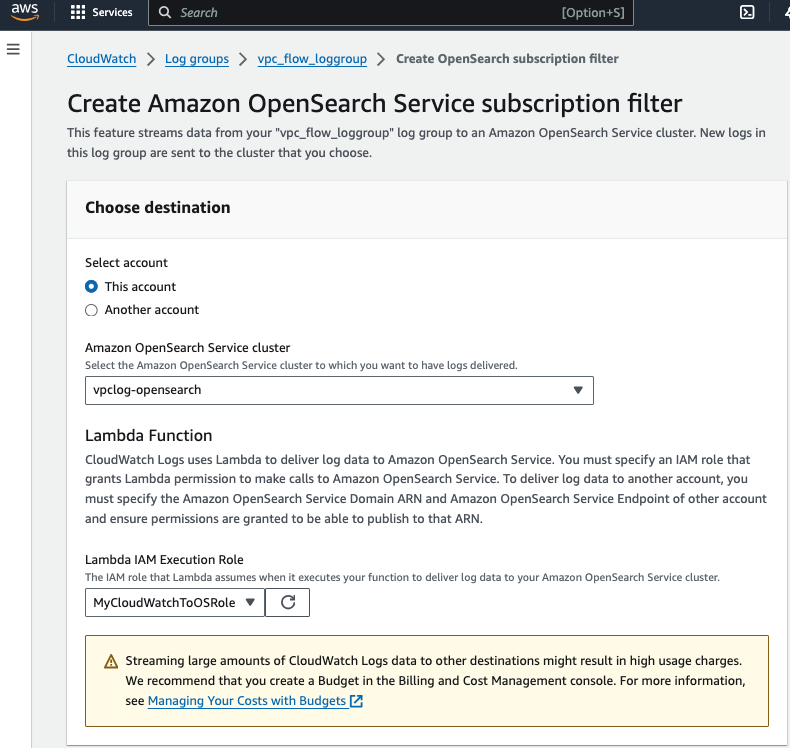
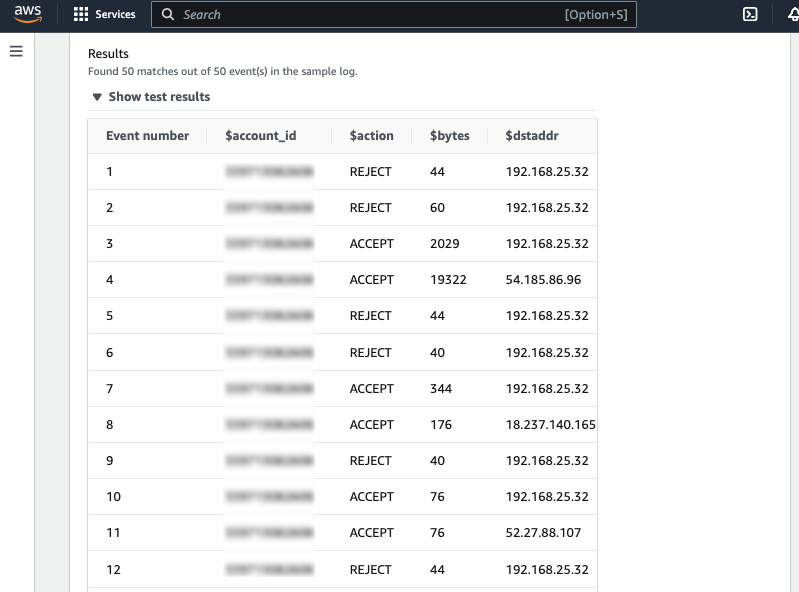
For Log format, choose Amazon VPC Flow Logs, test the log pattern and verify the test results.
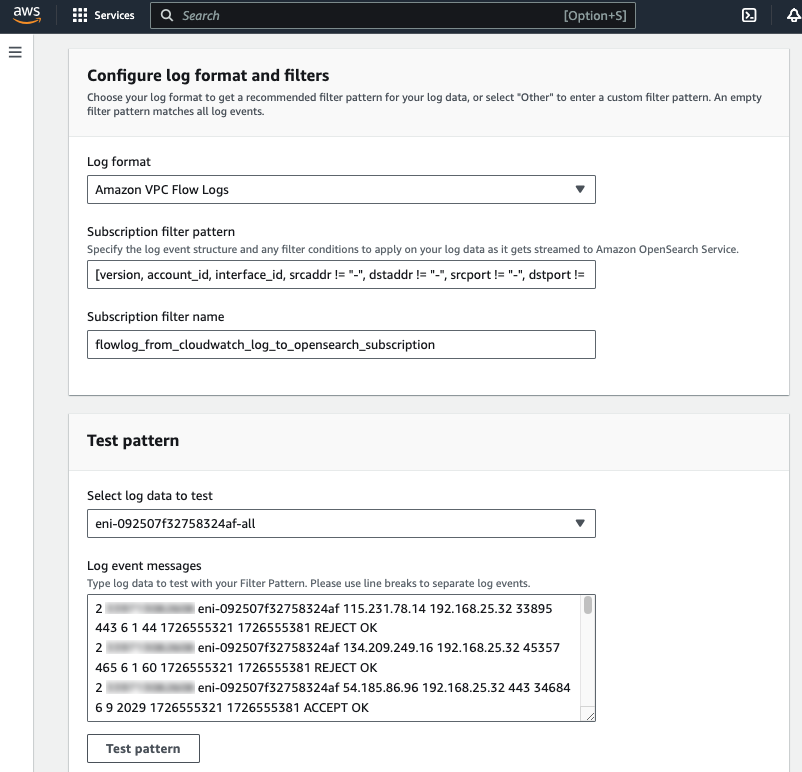
The VPC flow logs are parsed correctly using the subscription filter pattern.
Step 5: Set Up OpenSearch Dashboard
To access the OpenSearch Dashboard, in the AWS Management Console, navigate to your OpenSearch domain and select OpenSearch Dashboards URL. Log in using the credentials you set up while creating the OpenSearch domain.
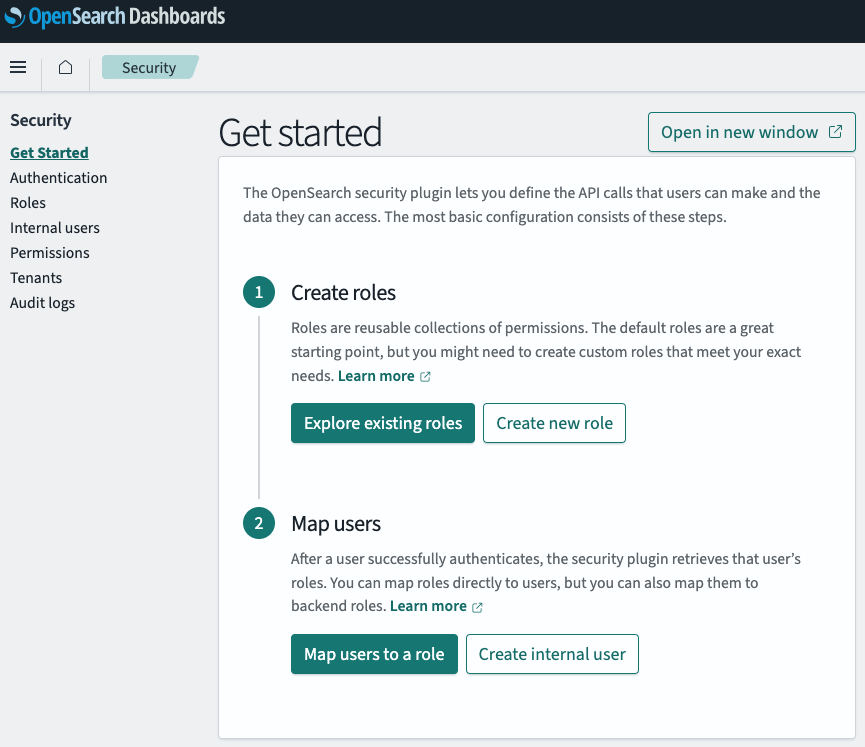
Create a Role and Mapped user:
- Go to OpenSearch -> Management -> Security, choose Explore existing roles
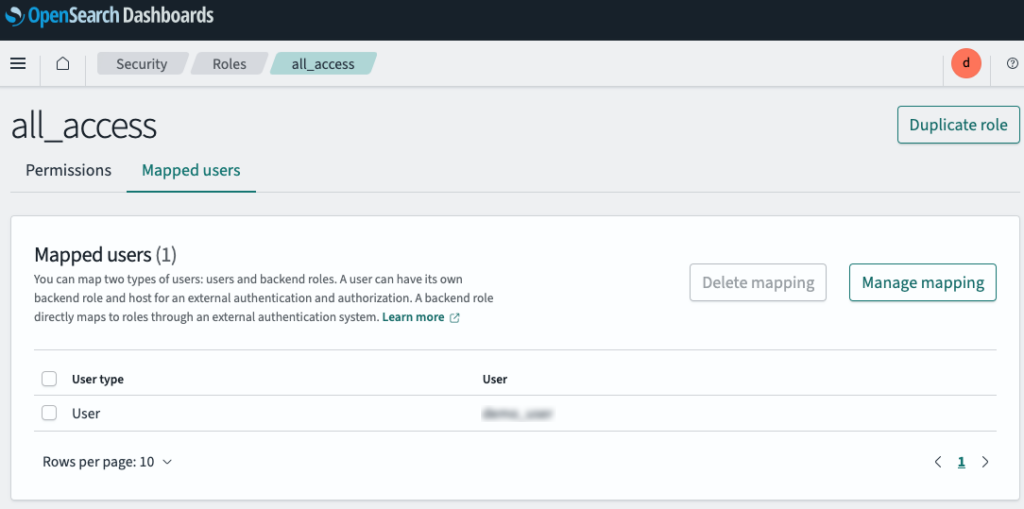
- Find the all_access role and choose Manage mapping
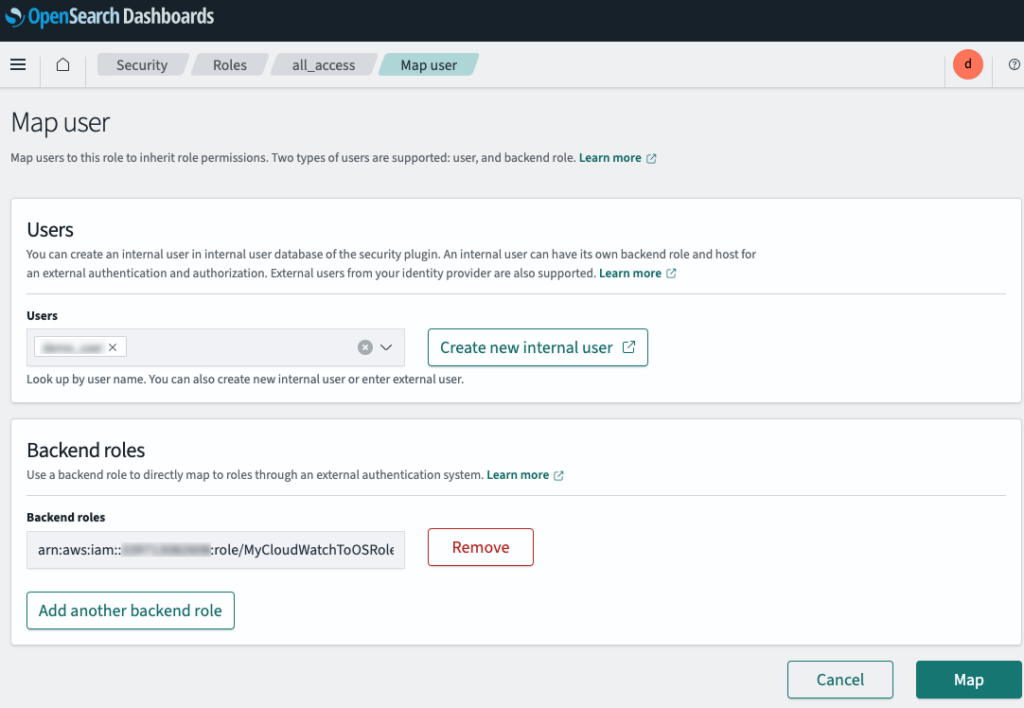
- Copy and paste the ARN of the IAM role (MyCloudWatchToOSRole) to the Backend roles to give the role full permission to the cluster

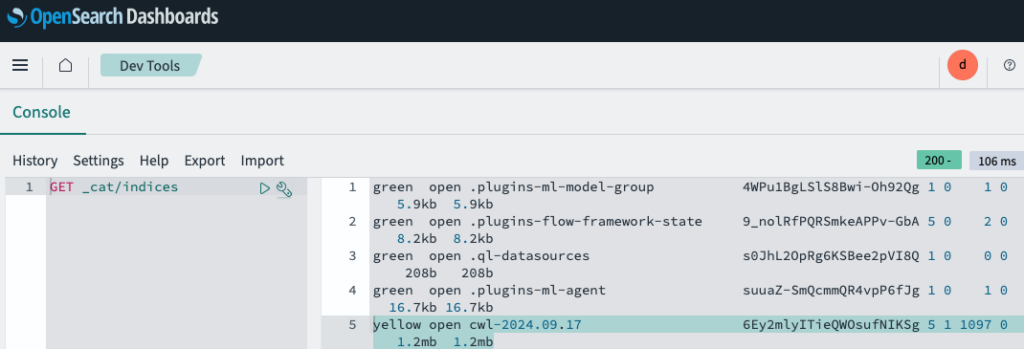
To verify that vpc flow log is being ingested to OpenSearch cluster, go to Dev Tools and enter the following command in the console:
GET _cat/indicesAn index named cwl-yyyy.mm.dd has been created. Unlike other indices that are green, the cwl index is yellow because this is a single node setup with no other node to synchronize.
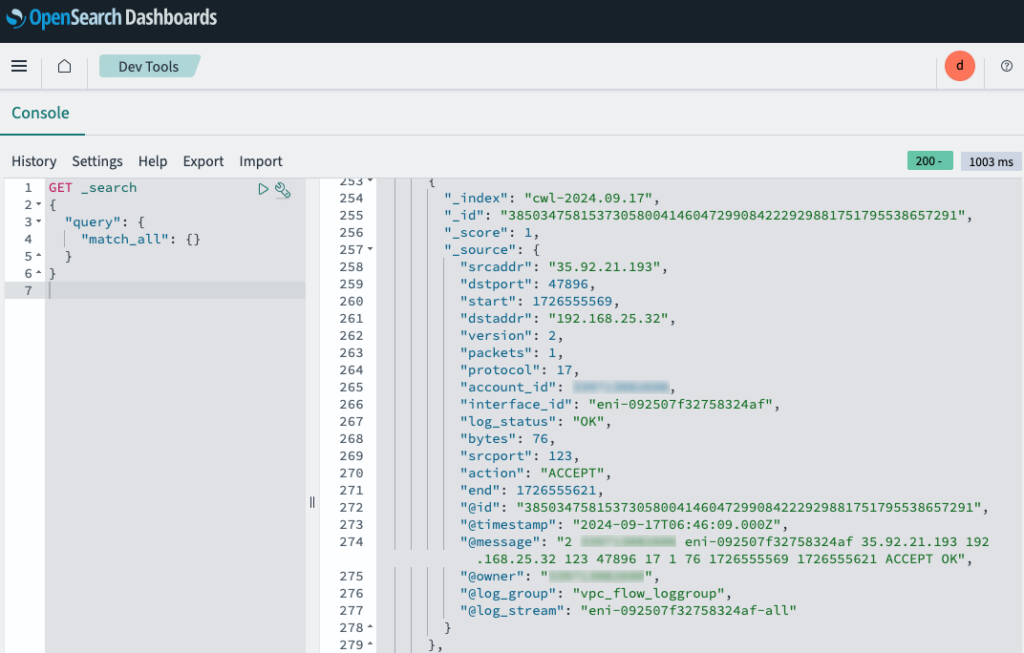
We can also retrieve all the documents in the index with this command:
GET _search
{
  "query": {
    "match_all": {}
  }
}
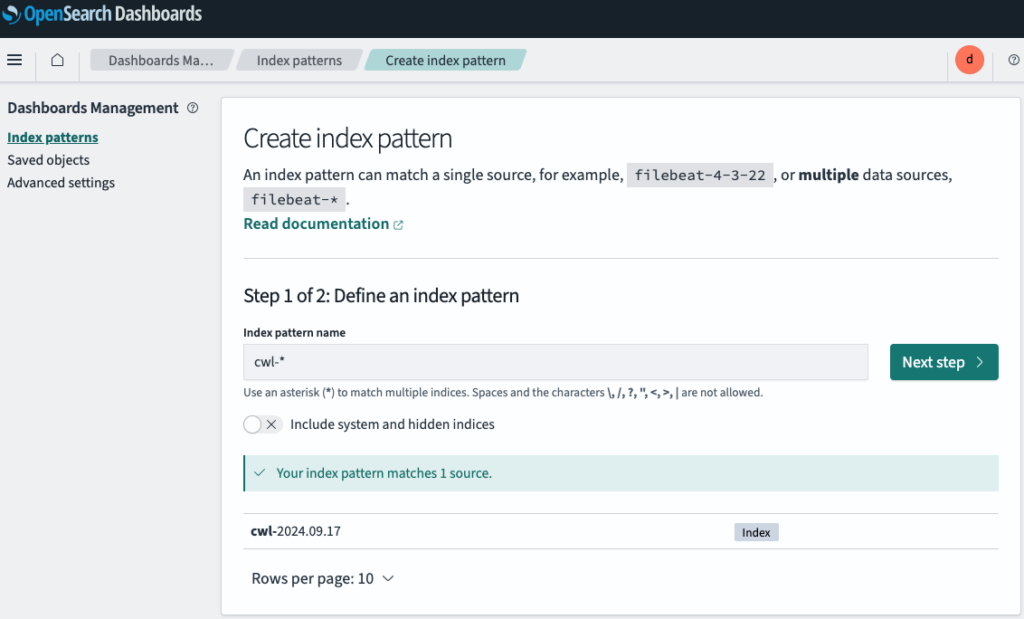
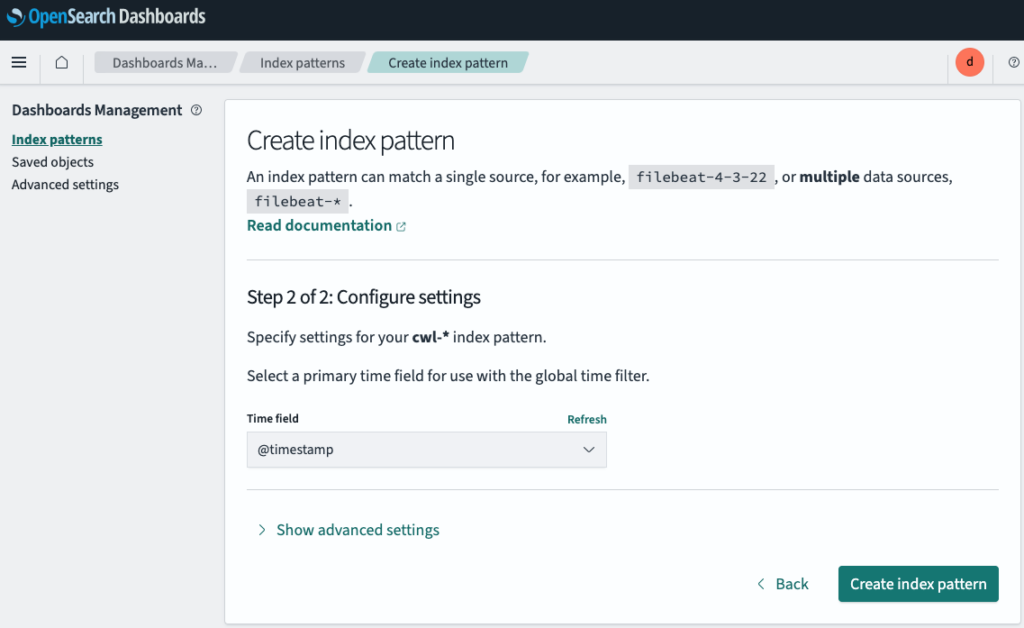
To create an index pattern, go to OpenSearch -> Discover-> Create Index Patterns.
- For Index pattern name, enter cwl-*, then go to next step.
- For Time field, choose @timestamp to create the index pattern.
Step 6: Analyzing VPC Flow Logs Using the OpenSearch Dashboard
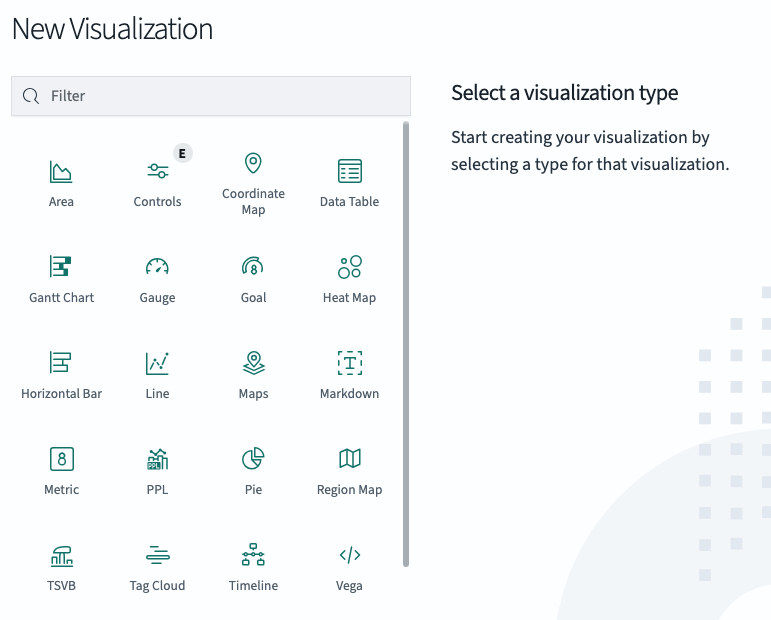
To Create Visualizations and Dashboard, go to Visualize Library in OpenSearch Dashboards and create visualizations such as area graphs, pie charts, and data tables based on the VPC Flow Logs data.
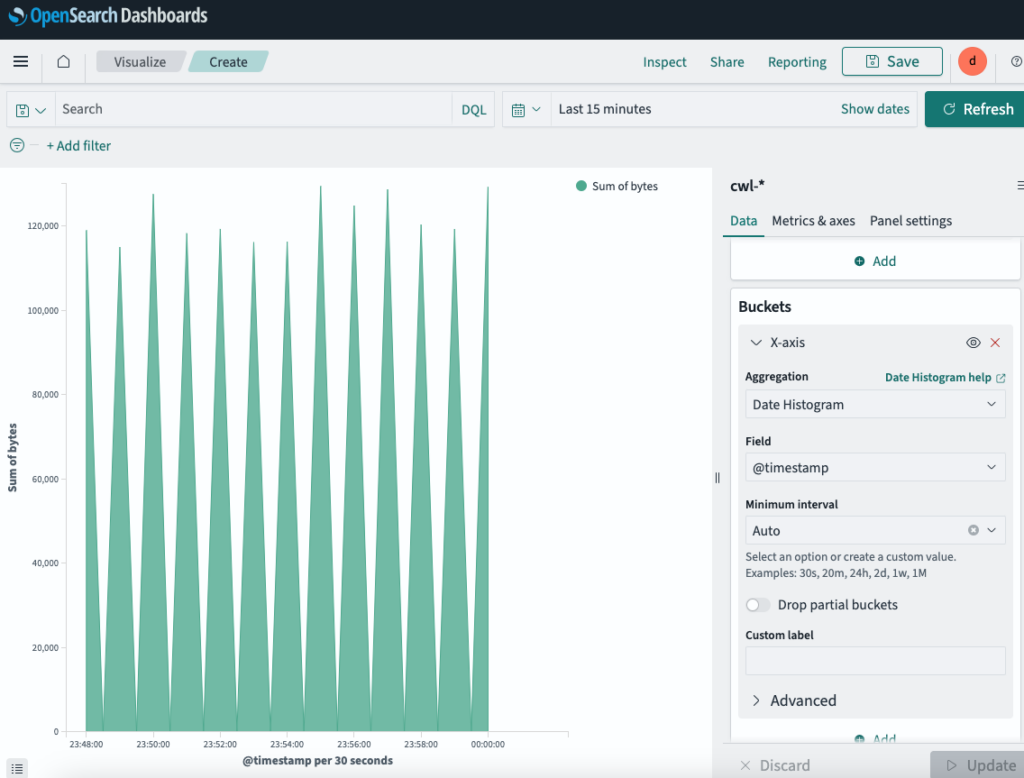
Let’s create our first visualization to sum up the traffic volume using Area graph.
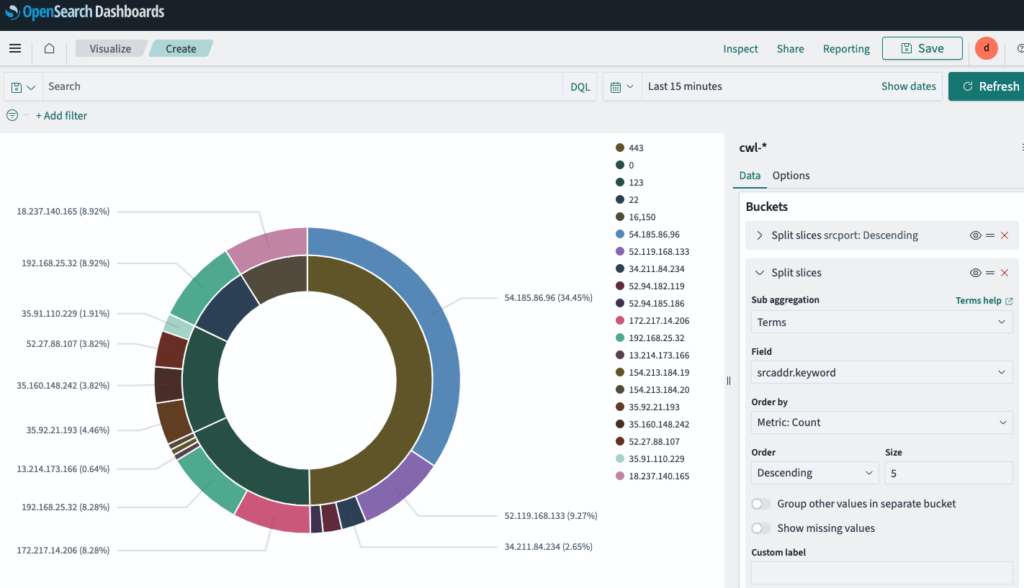
Add a second visual to track all incoming traffic IP addresses to our VPC using a pie chart. The outer layer is the Source IP address and inner layer is their port number.
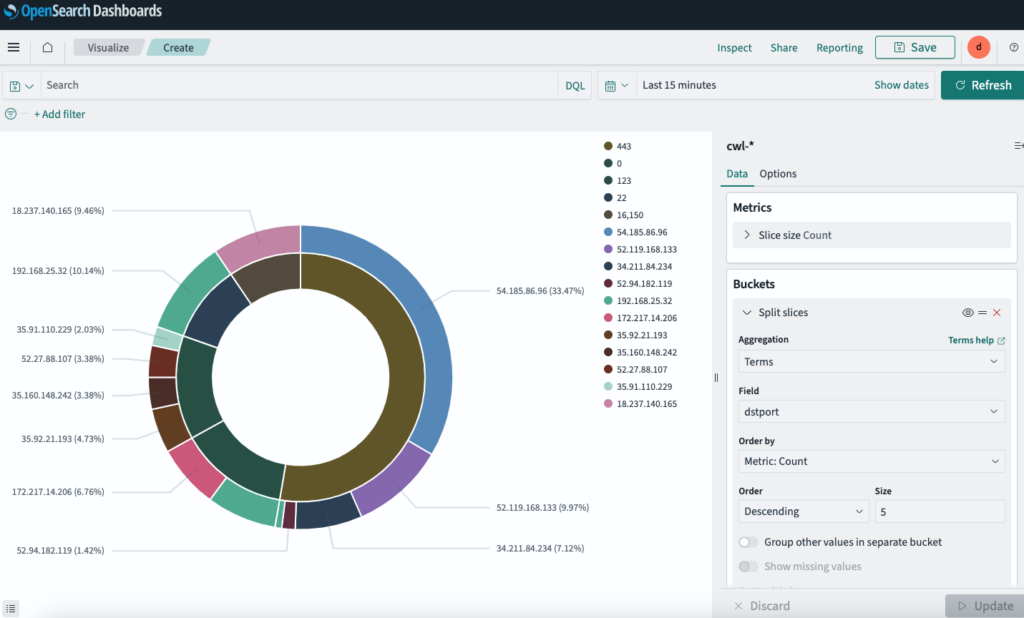
Create a similar pie chart for the Destination IP address and port number.
For our last visual, add a pie chart to show the percentage of Accepted/Rejected traffic.
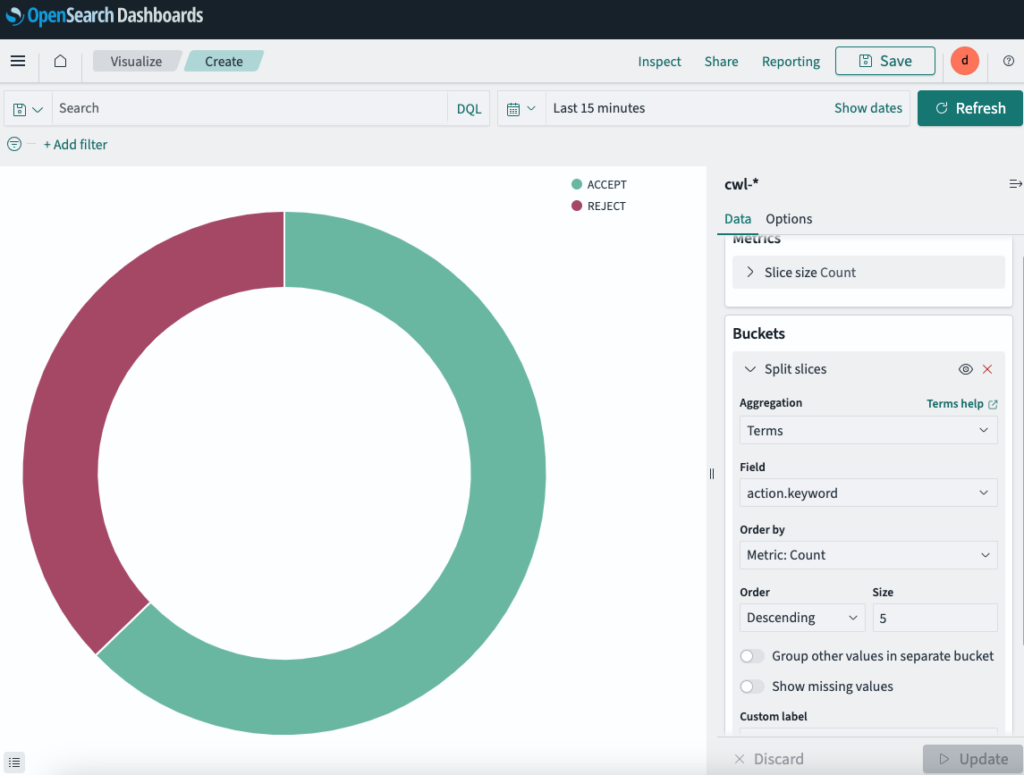
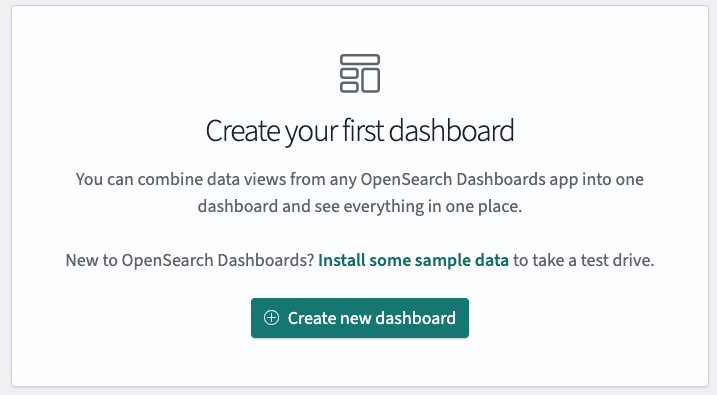
Now that we have all the visuals ready, let’s create a Dashboard to see everything in one place.
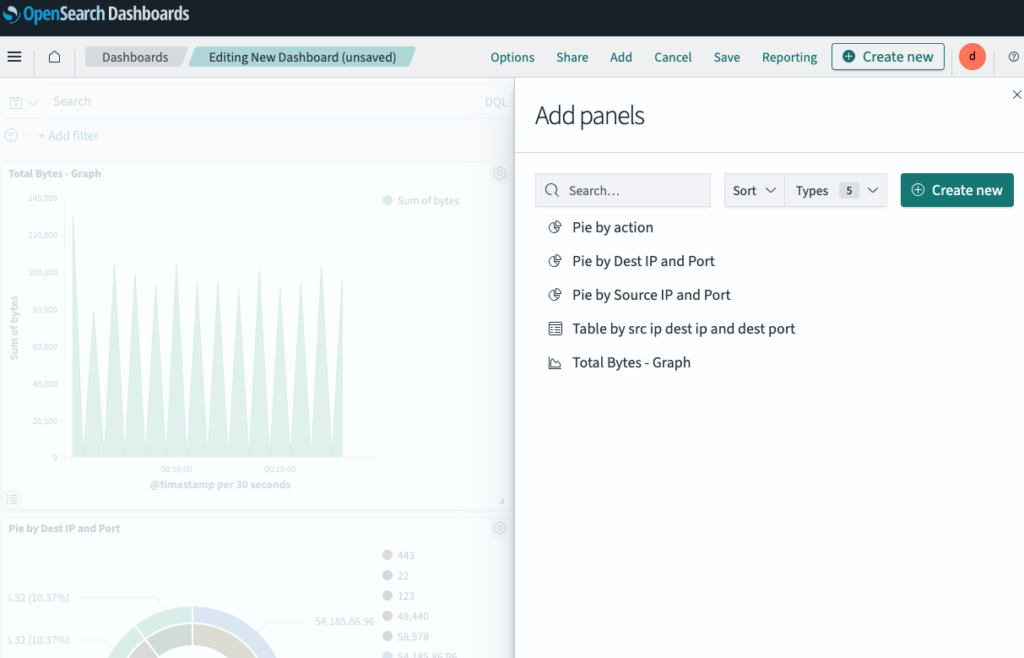
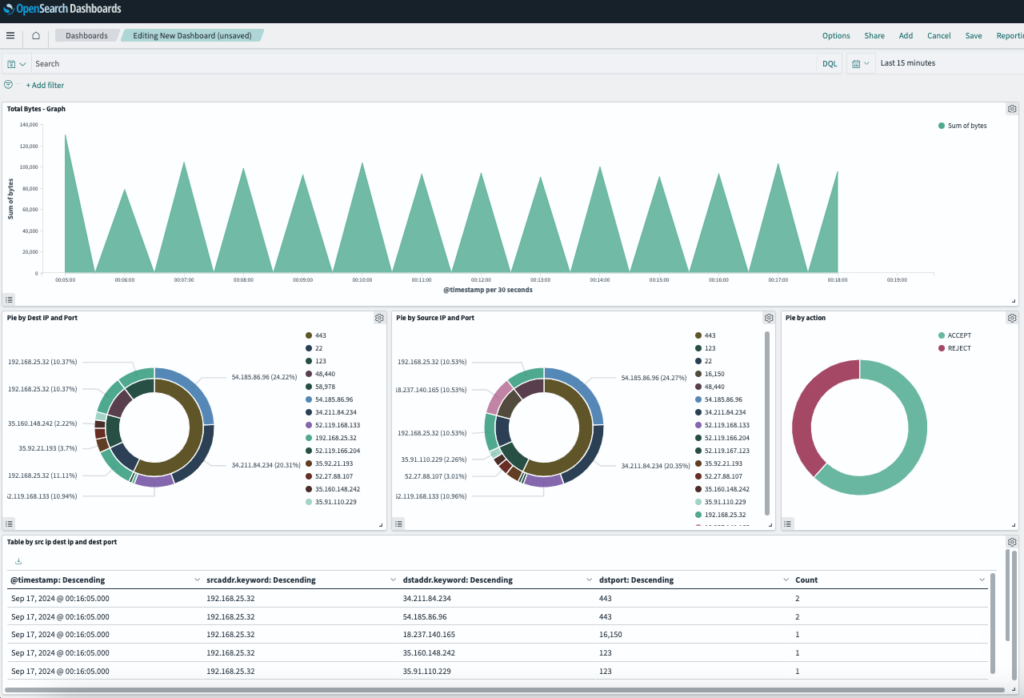
With the logs ingested and visualizations set up, we can use the OpenSearch Dashboards to:
- Monitor Traffic: Identify trends in network traffic, bandwidth consumption, and unusual activities (e.g., spikes in outbound traffic).
- Troubleshoot Network Issues: Analyze failed connections, packet loss, and latency by filtering logs based on attributes like source/destination IPs, ports, and protocols.
- Security Analysis: Detect potential security threats by monitoring unauthorized access attempts, suspicious IP addresses, or abnormal data flows.


