This blog will guide you through setting up log analytics, monitoring and alert for a Google Kubernetes Engine (GKE) cluster using the Hipster Shop Observability Demo Application as reference.
1. Introduction to Kubernetes Monitoring and Log Analytics
Monitoring and log analytics in Kubernetes are essential for ensuring:
- Performance: Detecting latency issues, CPU bottlenecks (e.g. throttling), and slowdowns.
- Reliability: Catching errors and failures before they impact end-users.
- Security: Identifying security anomalies like unauthorized access.
Effective monitoring and logging provide insights into application health, inter-service communication, and resource usage, enabling faster troubleshooting and optimization.
2. Why Use Hipster Shop as a Demo?
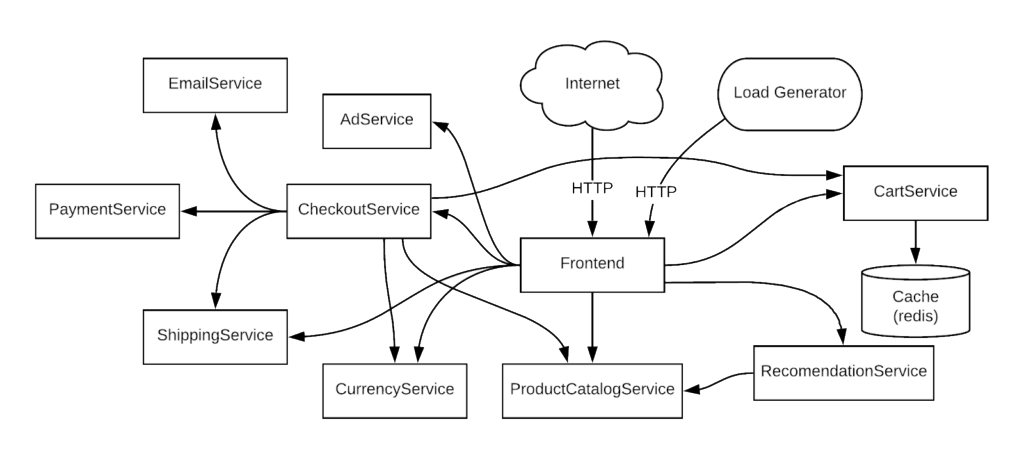
Hipster Shop is a microservices-based application designed by Google, simulating an e-commerce platform. It consists of several services (e.g., emailservice, checkoutservice, cartservice, etc.), making it an ideal reference for:
- Microservices Monitoring: Hipster Shop’s architecture mirrors real-world applications with interdependent services.
- Load Testing: The demo includes a
loadgeneratorto simulate realistic traffic. - Dynatrace Integration: The demo supports full observability with tools like Dynatrace to monitor, analyze, and troubleshoot services.
3. Setting Up Google Kubernetes Engine (GKE)
Prerequisite:
Ensure the following tools are installed on your machine:
- kubectl
- gcloud
- git
- helm
- jq
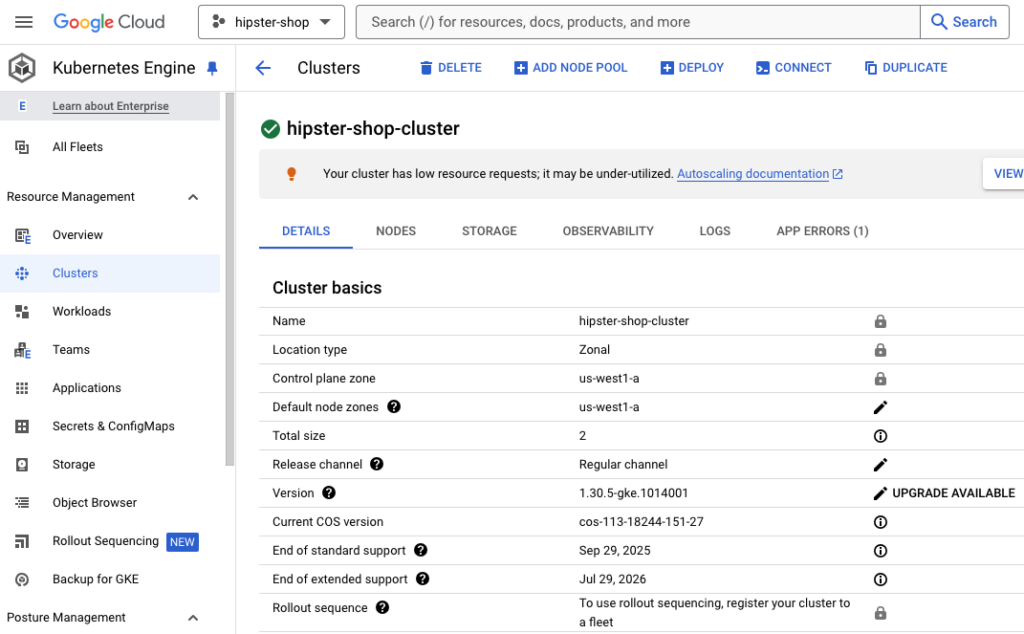
Step 1: Create a GKE Cluster
Start by creating a GKE cluster via the Google Cloud Console or CLI:
gcloud container clusters create hipster-shop-cluster \
    --zone us-west1-a \
    --num-nodes 2 \
    --machine-type e2-standard-8
This sets up a Kubernetes cluster with two nodes, each configured for microservices deployment.
4. Deploying Hipster Shop on GKE
Clone the Hipster Shop Repository:
https://github.com/GoogleCloudPlatform/microservices-demo.gitDeploy Hipster Shop to GKE:
kubectl apply -f ./release/kubernetes-manifests.yaml -n hipster-shopThis command deploys each microservice along with their configurations, such as services and deployments, into the GKE cluster.
Verify the pods are ready:
kubectl get pods -n hipster-shopAfter a few minutes, you should see the pods are in a running state.
NAME                                     READY   STATUS    RESTARTS   AGE
adservice-86d5fd9c56-tprp6               1/1     Running   0          75s
cartservice-6bb7677d47-lv25q             1/1     Running   0          78s
checkoutservice-64fd47cdfb-ldm8w         1/1     Running   0          81s
currencyservice-8587877797-q24bg         1/1     Running   0          77s
emailservice-78d967474f-bdl2k            1/1     Running   0          82s
frontend-84fb499859-f66dw                1/1     Running   0          79s
paymentservice-c5fb8bfb6-6cvs8           1/1     Running   0          79s
productcatalogservice-64cffd9d98-7vdhl   1/1     Running   0          78s
recommendationservice-549cc495d-285w5    1/1     Running   0          80s
redis-cart-867cd85fd4-l6zkm              2/2     Running   0          76s
shippingservice-685bc78f7b-jjg9z         1/1     Running   0          77s
Expose the Frontend:
helm upgrade --install ingress-nginx ingress-nginx --repo https://kubernetes.github.io/ingress-nginx --namespace ingress-nginx --create-namespace
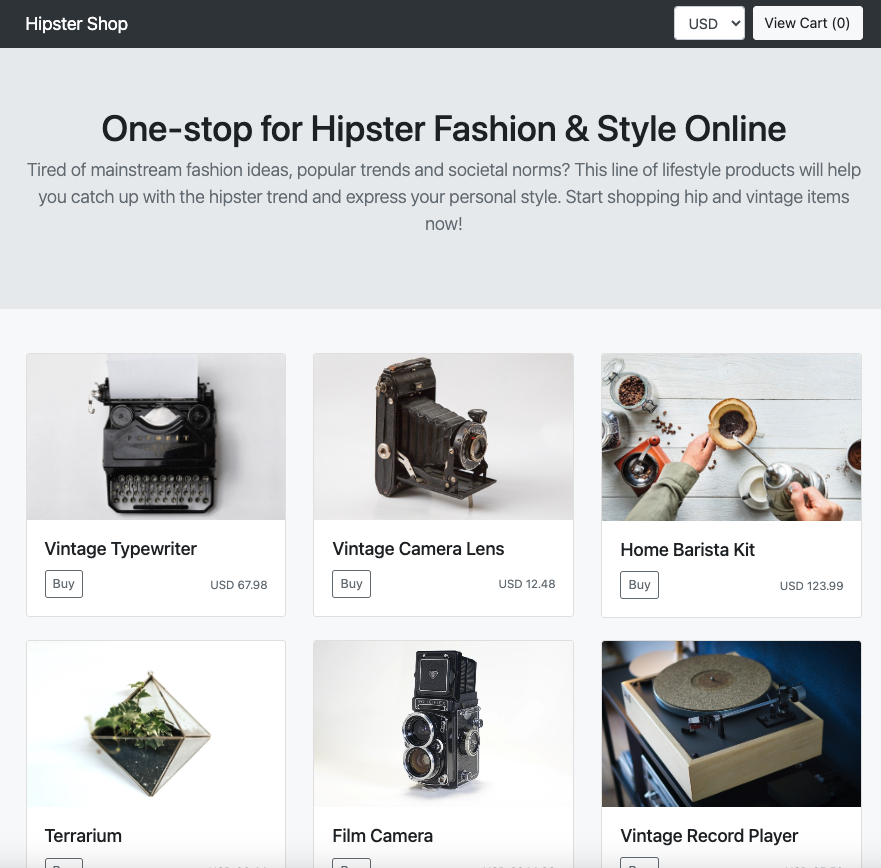
This command installs the NGINX Ingress Controller as a load balancer to exposes the frontend of the Hipster Shop application.
Get the URL to your deployed Hipster Shop:
kubectl get svc ingress-nginx-controller -n ingress-nginx -ojson | jq -j '.status.loadBalancer.ingress[].ip'
5. Implementing Log Analytics in GKE
There are two ways you can enable Log Analytics to get insights into your GKE cluster. One way is to upgrade an existing bucket. The other is to create a new log bucket with Log Analytics enabled.
Step 1: Create a new log bucket
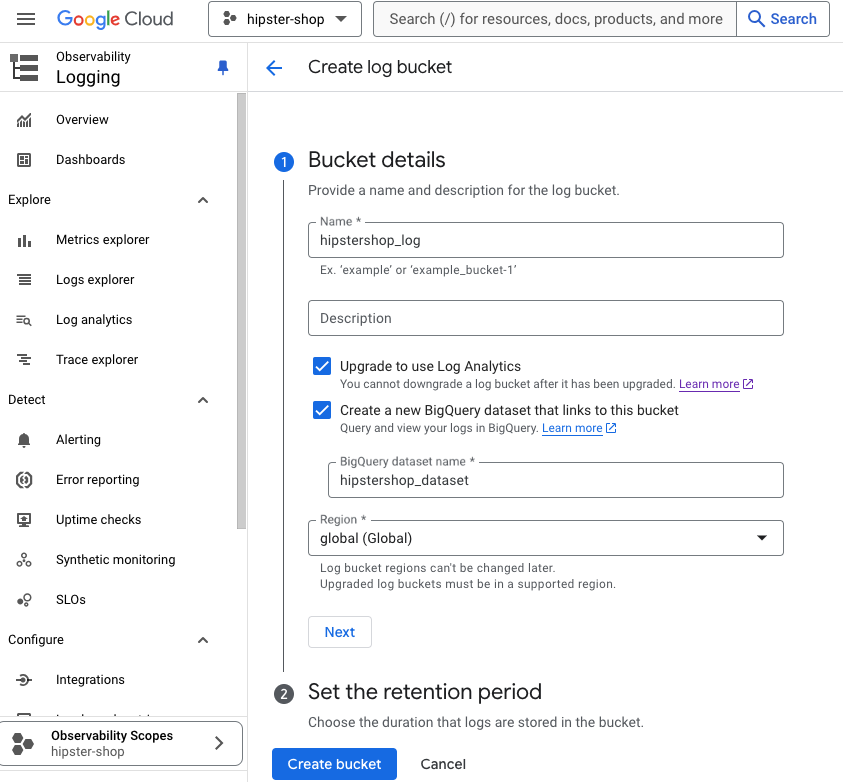
You can configure Cloud Logging to create a new log bucket with Log Analytics enabled.
- Navigate to Logging, then click Logs Storage in the Cloud Console
- Click CREATE LOG BUCKET at top, name the log bucket as hipstershop_log
- Check both Upgrade to use Log Analytics and Create a new BigQuery dataset that links to this bucket
- Type in a dataset name like hipstershop_dataset
- Click Create bucket to create the log bucket
Step 2: Write to the new log bucket
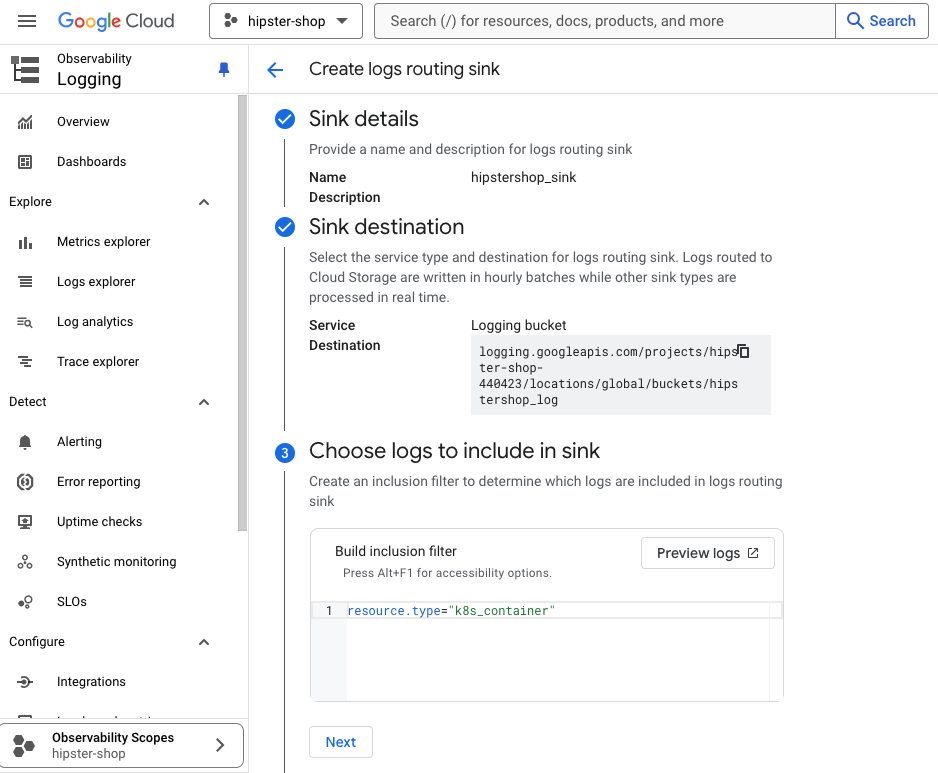
To write logs from our GKE cluster to the new log bucket, you need to create a log sink and specify the log destination and setup a log filter for logging the gke cluster.
Navigate to Logging, then click Logs Explorer in the Cloud Console, and enable Show query on the top right and add the following filter.
resource.type="k8s_container"Click on Actions and then Create sink.
- Name the sink as hipstershop_sink
- Select Logging bucket in the sink service, then choose hipstershop_log bucket
- Click CREATE SINK
Step 3: Perform analytics on logs
Now we can perform analytics on logs stored in the hipster shop log bucket by running our own query in Log Analytics. In the Log views list, select the hipstershop_log._AllLogs, and then select Query. The Query pane is populated with a default query, which includes the log view that is queried.

To find the min, max and average latency (in ms) for the frontend service:
SELECT hour,
MIN(took_ms) AS min,
MAX(took_ms) AS max,
AVG(took_ms) AS avg
FROM ( SELECT
  FORMAT_TIMESTAMP("%H", timestamp) AS hour,
  CAST( JSON_VALUE(json_payload,
      '$."http.resp.took_ms"') AS INT64 ) AS took_ms
FROM `hipster-shop-440423.global.hipstershop_log._AllLogs`
WHERE
  json_payload IS NOT NULL
  AND SEARCH(labels,"frontend")
  AND JSON_VALUE(json_payload.message) = "request complete"
ORDER BY took_ms DESC, timestamp ASC )
GROUP BY 1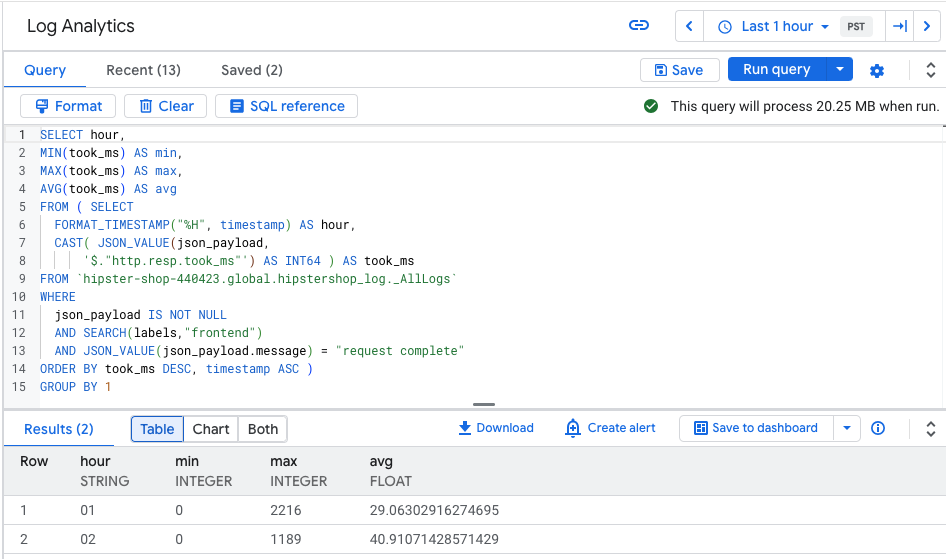
To find all sessions with shopping cart checkout:
SELECT
 JSON_VALUE(json_payload.session) as session_id ,COUNT(*) as count
FROM `hipster-shop-440423.global.hipstershop_log._AllLogs`
WHERE
 JSON_VALUE(json_payload['http.req.method']) = "POST"
 AND JSON_VALUE(json_payload['http.req.path']) = "/cart/checkout"
GROUP BY
 JSON_VALUE(json_payload.session)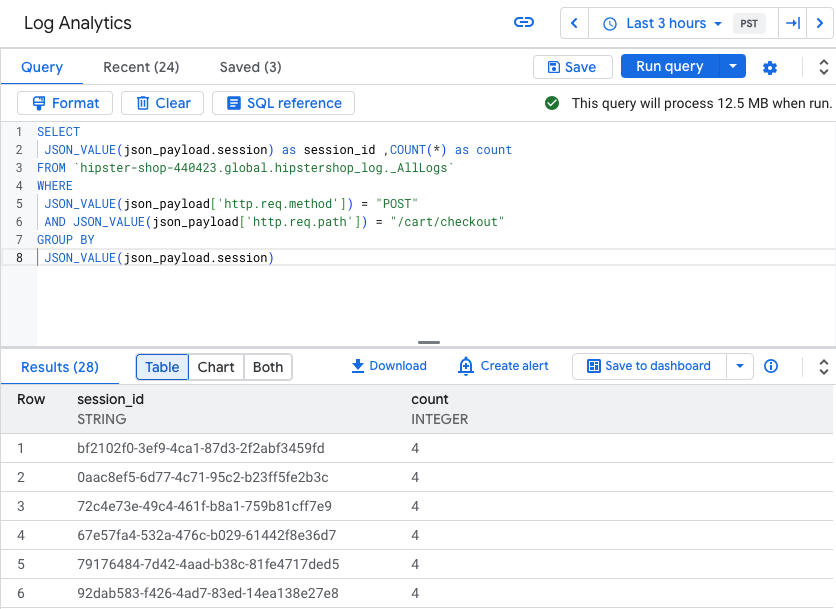
6. Monitoring your GKE cluster health with Dashboards and Alert
To effectively monitor your GKE cluster and observe how it handles the load generated by the Hipster Shop demo application, you can set up a custom Google Cloud Monitoring dashboard to display key metrics such as CPU Request Utilization or Memory Limit Utilization, giving you insights into resource usage. For instance, we want to monitor the CPU utilization because if it consistently nears or exceeds 100%, our cluster may be at risk of CPU throttling, which can degrade application performance.
Step 1: Create a Custom Dashboard to monitor your pods
- Go to the Google Cloud Console and open Monitoring
- Select Metrics Explorer from the left menu and click on Select a metric
- Select Kubernetes Container > Popular Metrics > CPU request utilization
- Click Apply
- Now click the Save Chart button and name the dashboard as K8s Container Dashboard
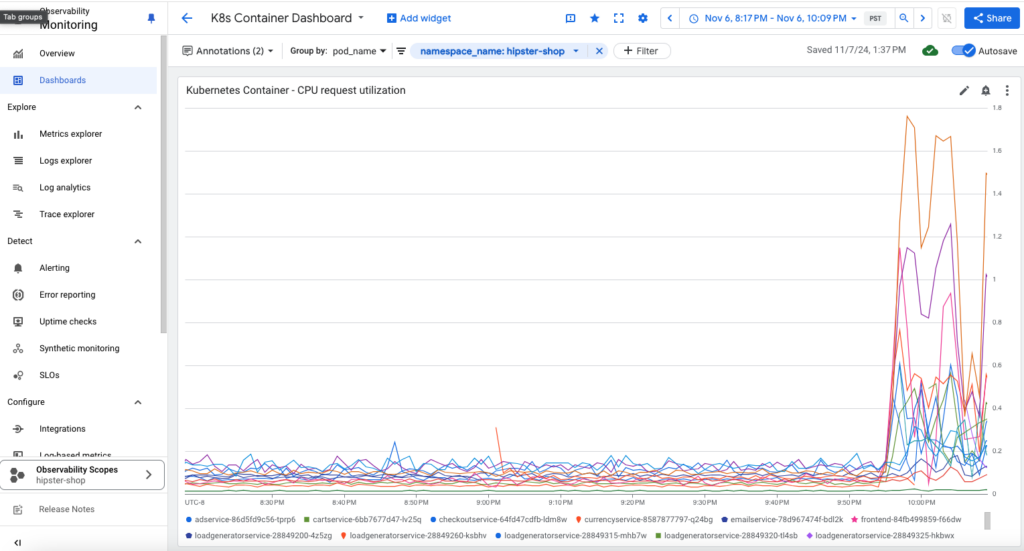
Step 2: Create an Alert to Identify Incident
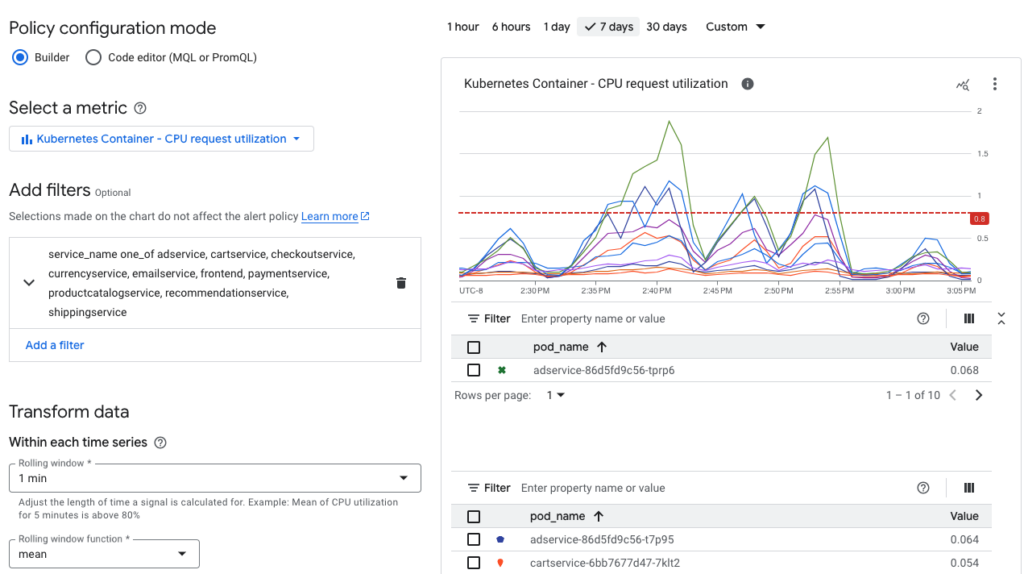
We will create an alert policy to detect high CPU utilization among the containers and send notifications when the CPU usage exceeds a specific threshold, indicating potential resource constraints. Then we can use the dashboard to identify and respond to the incident.
- In the Cloud Console, navigate to Monitoring > Alerting
- Click + Create Policy
- Click on Select a metric dropdown
- Uncheck the Active option
- Click on Kubernetes Container > Container->CPU request utilization, then click Apply
- Set Rolling windows to 1 min, click Next
- Set Threshold position to Above Threshold
- Choose Threshold and define a Threshold value (e.g., 0.8 for 80% utilization)
- Under Advanced Options, set Retest window to 5 min. By using a retest window, you can reduce the number of unnecessary alerts that might occur due to temporary anomalies in metrics. Click Next
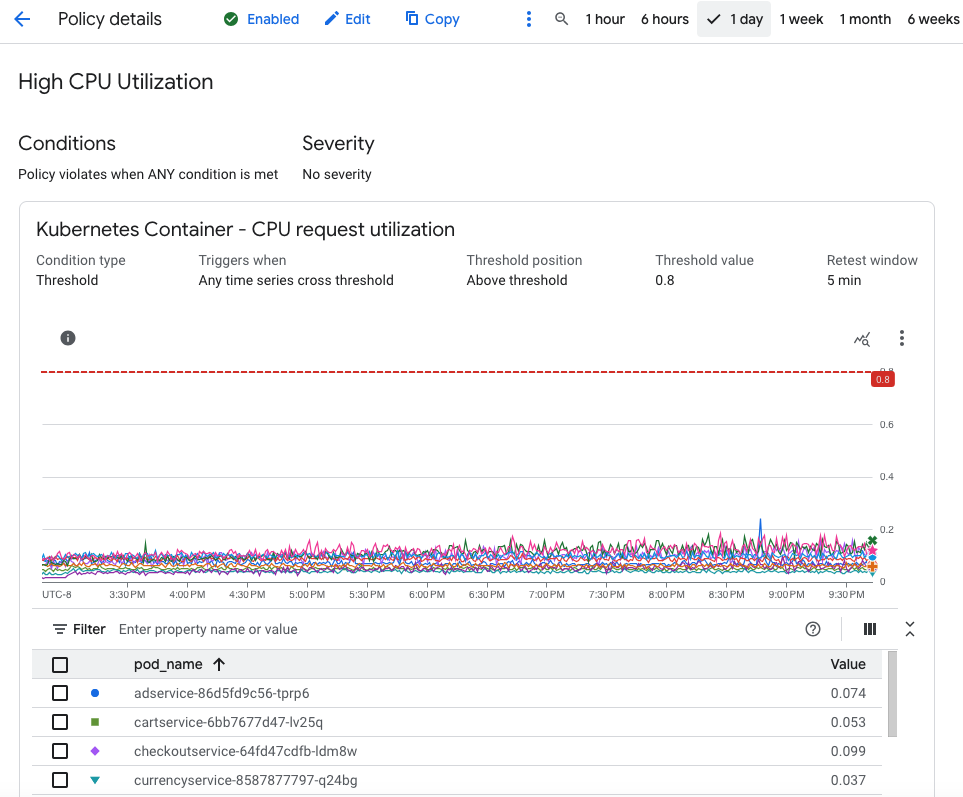
- Configure Notification Channels – Choose how you’d like to be notified (e.g., email, Slack, SMS), name the alert policy and then click Create Policy
Step 3: Monitor and Respond
With the dashboard and alert policy in place, you can now:
- View real-time insights on CPU usage and active users.
- Receive alerts when CPU usage exceeds the set threshold, allowing you to investigate and address potential issues before they impact the application’s performance.
7. Load Testing and Stress Analysis
We will use the loadgenerator included in the Hipster Shop demo application to simulate some user traffic.
Update Kubernetes Configuration for the Loadgenerator
In k8s-manifest.yaml, you can adjust how the loadgenerator runs in your cluster:
- Concurrency and Duration: Define how many users and how long they should interact with the app.
- Resource Limits: Adjust resource requests/limits to control how much CPU and memory the loadgenerator uses.
apiVersion: batch/v1
kind: CronJob
metadata:
  name: loadgeneratorservice
  labels:
    app.kubernetes.io/component: loadgenerator
    app.kubernetes.io/part-of: hipster-shop
    app.kubernetes.io/name: loadgenerator
spec:
  schedule: "*/15 * * * *"  # Runs every 15 minutes
  jobTemplate:
    spec:
      template:
        spec:
          restartPolicy: OnFailure
          containers:
            - name: loadgenerator
              image: loadgenerator-image
args: ["-u", "50", "-d", "10m"]- Schedule:
"*/15 * * * *"triggers the CronJob every 15 minutes. - Number of virtual users (
-u50) is set to 50. For heavier load, increase this value. - Duration: Set the duration (
-d 10m) in theargsto 10 minutes to allow a short break between runs. This prevents overlap between consecutive jobs and allows each job to finish before the next one starts
After configuring, you can deploy the modified loadgenerator to your GKE cluster:
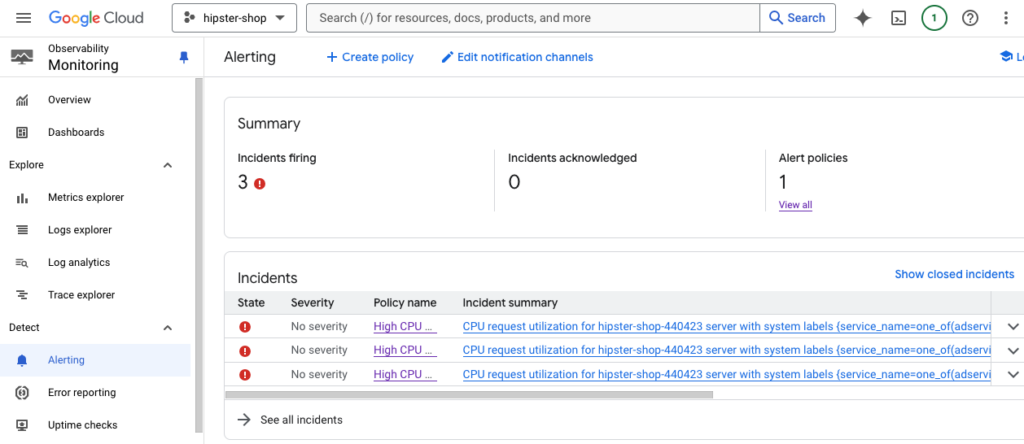
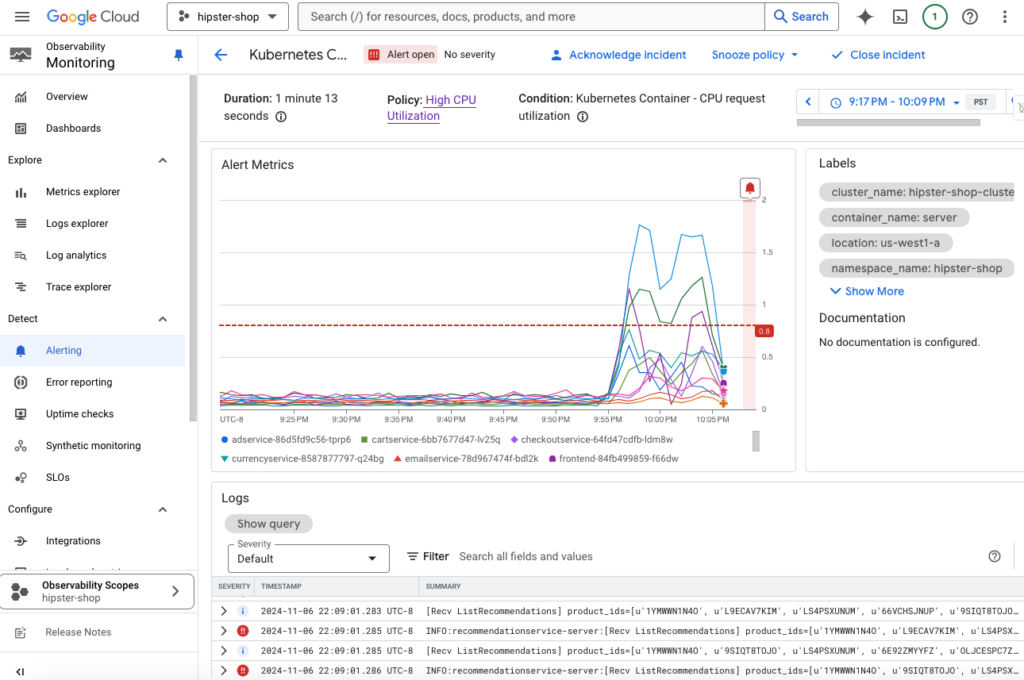
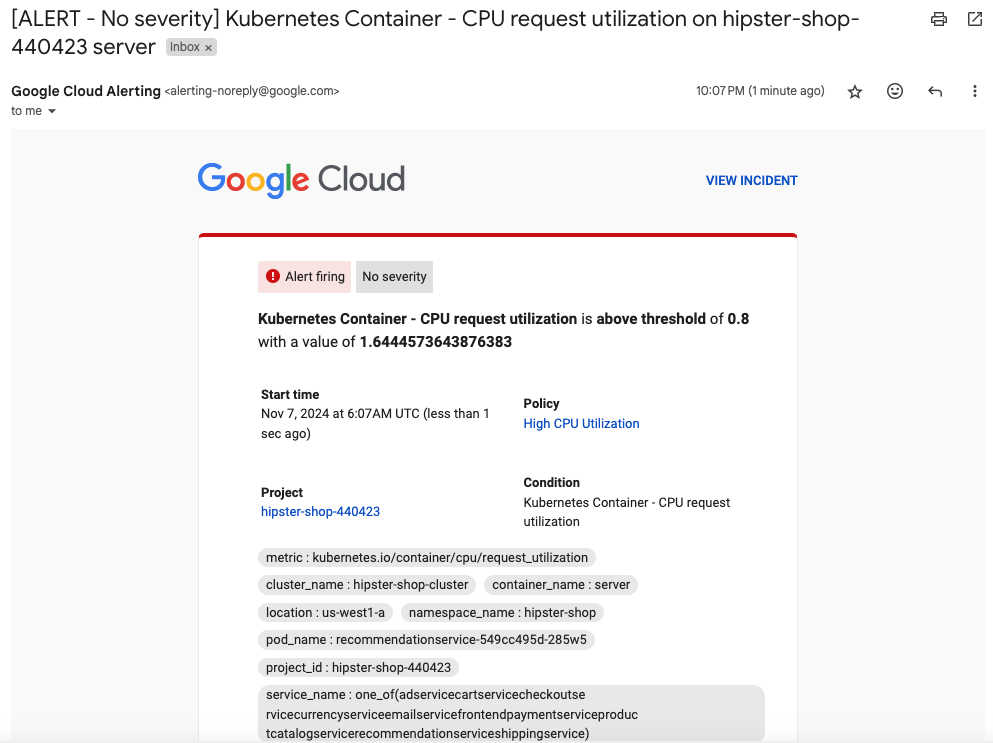
kubectl apply -f k8s-manifest.yaml -n hipster-shopThis will apply a load to the web store and after a while we will start receiving alert notifications. We can open the incident summary and respond to it by clicking on Acknowledge Incident. The incident status now shows Acknowledged, but that doesn’t solve the problem. In reality, you need to fix the root cause of the problem.
10. Conclusion
Monitoring and log analytics are essential for managing complex microservices applications in Kubernetes. Using Google Log Analytics and Monitoring, you can ensure comprehensive observability for your GKE cluster and container application. But monitoring doesn’t stop at metrics; actionable insights into logs and traces help you detect and resolve issues faster, ensuring your applications are always running smoothly.
Thank you for reading my blog and I hope you like it!

