In my previous article, I explored the observability and monitoring tools for managing microservices architectures on Google Kubernetes Engine (GKE). In this article, I will compare these tools with Dynatrace’s Cloud Native Full-Stack deployment, focusing on how each handles CPU throttling issues.
While GKE’s tools offer solid observability, they often require navigating through multiple interfaces and piecing together data to get a full picture of an issue. An example of a limitation is that, while you can view individual metrics and trace information, correlating them across services and identifying the root cause of an issue, like CPU throttling, can require significant manual work. Dynatrace’s Cloud Native Full-Stack deployment provides a unified observability solution across the entire tech stack, from infrastructure to applications and real user experience. Key benefits include:
- Seamless, Unified Platform: Combines metrics, logs, traces, and user session data in one place.
- AI-Powered Root Cause Analysis: Dynatrace’s Davis AI continuously analyzes data to detect anomalies and determine the root cause of issues.
- Automation and Context: Automatically discovers dependencies across services, containers, and pods, giving teams a clearer view of performance in real time.
This unified, cross-platform view makes Dynatrace especially powerful for identifying resource constraints and managing microservices architectures effectively, as we’ll demonstrate below.
1. Setting Up Full Observability with Dynatrace Cloud Native Full Stack Deployment
In this section, we’ll walk through deploying the Dynatrace Operator with a Cloud Native Full-Stack configuration on a GKE cluster running the Hipster Shop demo app using Helm.
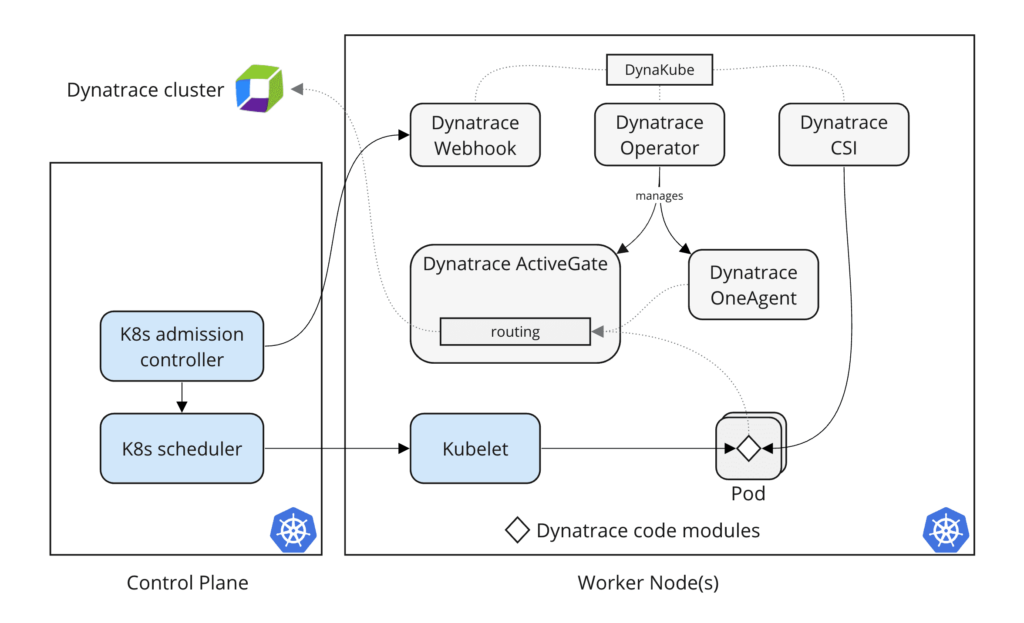
The following command installs Dynatrace Operator from an OCI registry and creates the necessary namespace:
helm install dynatrace-operator oci://public.ecr.aws/dynatrace/dynatrace-operator \
   --create-namespace \
   --namespace dynatrace \
   --atomic
Dynatrace operator needs an operator token and data ingest token to authorize API calls and ingest data to Dynatrace environment. After we have crated these tokens, we will create a secret named dynakube to hold these tokens:
kubectl -n dynatrace create secret generic dynakube --from-literal="apiToken=<OPERATOR_TOKEN>" --from-literal="dataIngestToken=<DATA_INGEST_TOKEN>"Finally, apply the DynaKube custom resource using a template from here and modify according to our needs:
kubectl apply -f cloudNativeFullStack.yamlAfter deployment, verify that all Dynatrace pods are running in the dynatrace namespace:
% kubectl get pods -n dynatrace
NAME                                  READY   STATUS    RESTARTS   AGE
dynatrace-oneagent-csi-driver-968jz   4/4     Running   0          96s
dynatrace-oneagent-csi-driver-ml69t   4/4     Running   0          96s
dynatrace-operator-6cd8884bbb-6wqhj   1/1     Running   0          96s
dynatrace-webhook-6d588d9f4c-q27zj    1/1     Running   0          95s
dynatrace-webhook-6d588d9f4c-v5ct9    1/1     Running   0          96s
After deployment Dynatrace to the GKE cluster, the Hipster Shop pods become fully observable with a set of built-in Kubernetes dashboards. This dashboard provides insights into all workloads, including metrics like CPU throttling that indicate potential performance issues.
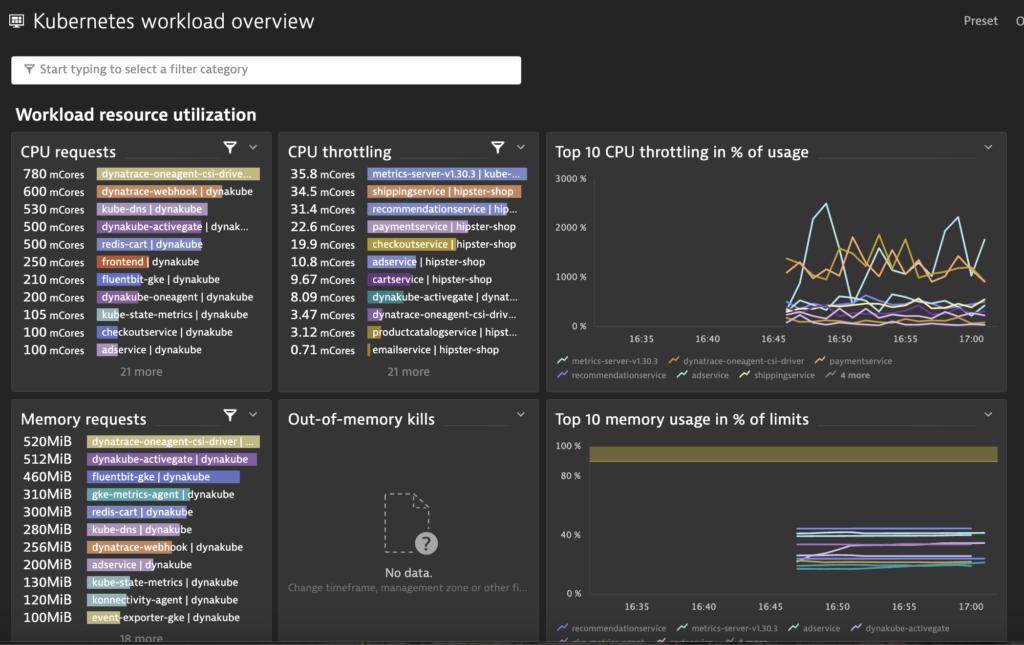
Why CPU throttling is bad?
Slower Response Times: When a container’s CPU usage hits its limit, Kubernetes throttles the container, restricting its ability to use additional CPU resources. This can slow down processing, causing noticeable delays in response times, especially for latency-sensitive applications.
Increased Latency Across Services: In microservices architectures, like the Hipster Shop app, delays in one service can ripple across dependent services, slowing the entire application.
2. Troubleshooting CPU Throttling with Dynatrace
We’ll use the load generator CronJob to simulate traffic on the Hipster Shop frontend, which put stress on various microservices, and use Dynatrace to diagnose and resolve CPU throttling issues.
Step 1: Run Load Generator and Monitor in Dynatrace
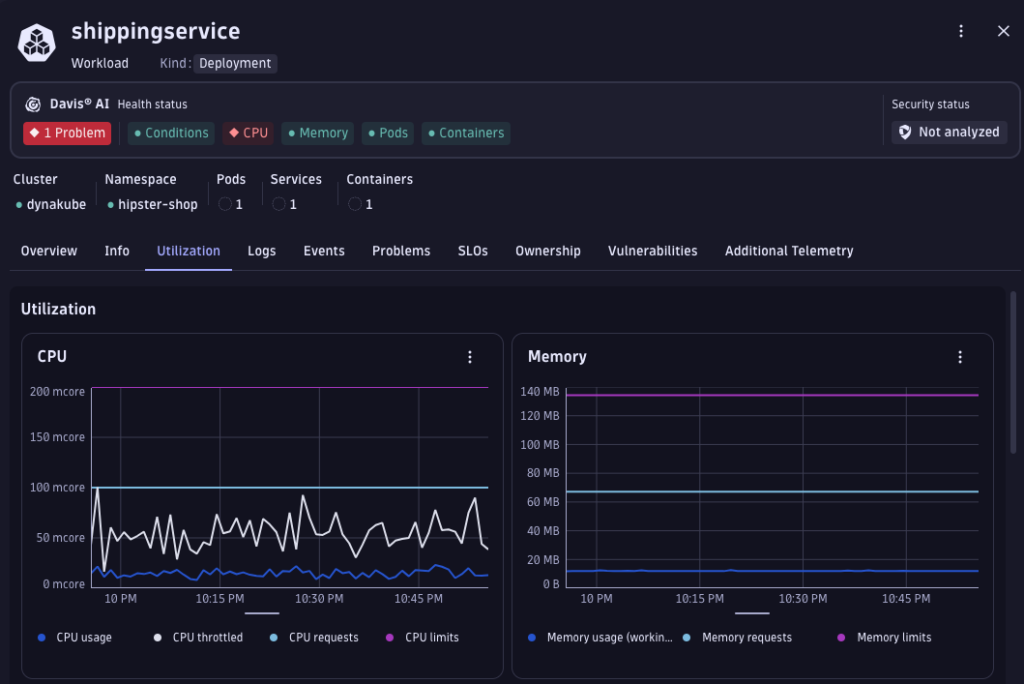
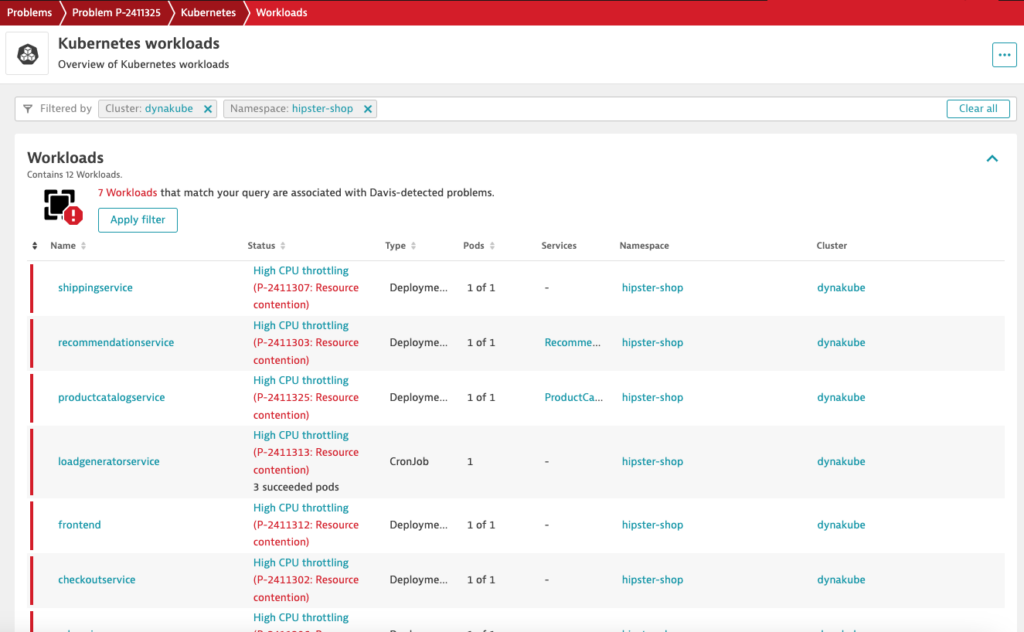
- Trigger the load generator to simulate high user traffic. In Dynatrace, you’ll see CPU throttling flagged automatically at different levels (workload, pod, cotainer)
Step 2: Detect CPU Throttling Alerts
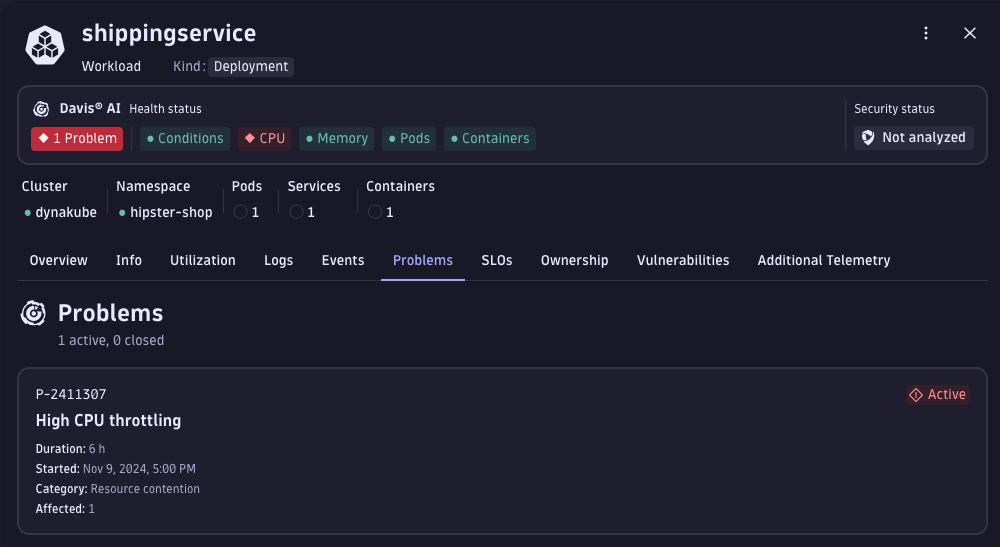
- Dynatrace’s Davis AI provides an immediate analysis, indicating whether CPU throttling is contributing to performance degradation. Clear alerts in the Problems console highlight throttling issues.
Step 3: Drill Down to Root Cause
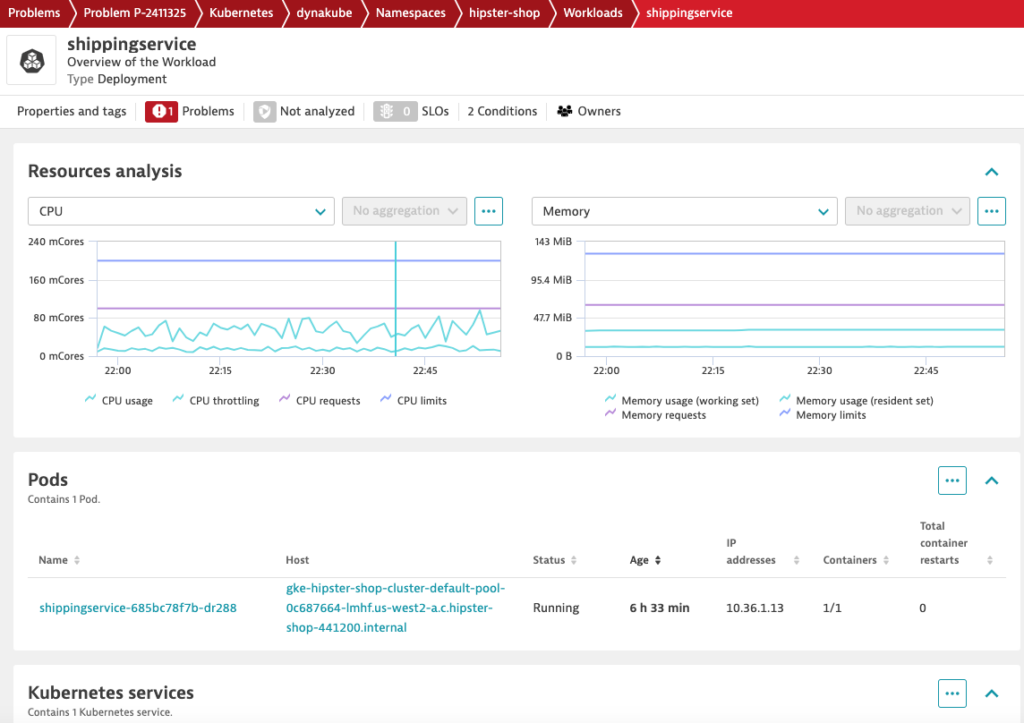
To see why CPU throttled, we can check whether the container CPU usage is close to the container CPU limit. In the container configuration for shippingservice, the resources settings are:
resources:
  requests:
    cpu: 100m
    memory: 64Mi
  limits:
    cpu: 200m
memory: 128Mi- requests: cpu: 100m, memory: 64Mi – this reserves a minimum of 100m CPU (i.e. 0.1 CPU core) and 64Mi memory for the shipping service container.
- limits: cpu: 200m, memory: 128Mi – Specifies the maximum amount of resources the container can use, preventing it from consuming excessive resources on the node.
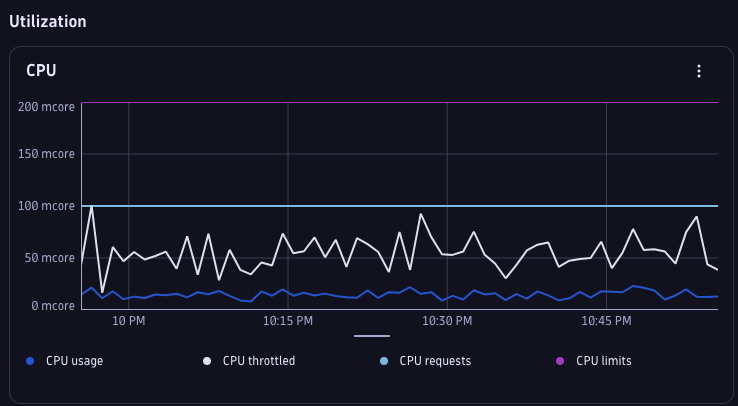
Looking at the CPU utlization of the shippingservice container, we observe that although the CPU usage is way below the container CPU limits (200m), it is close to the container CPU requests (100m) and thus causing the throttling.
Let’s increase both the shippingservice container’s CPU requests and limits to get more guaranteed CPU resources.
resources:
  requests:
    cpu: 200m
    memory: 64Mi
  limits:
    cpu: 300m
    memory: 128Mi
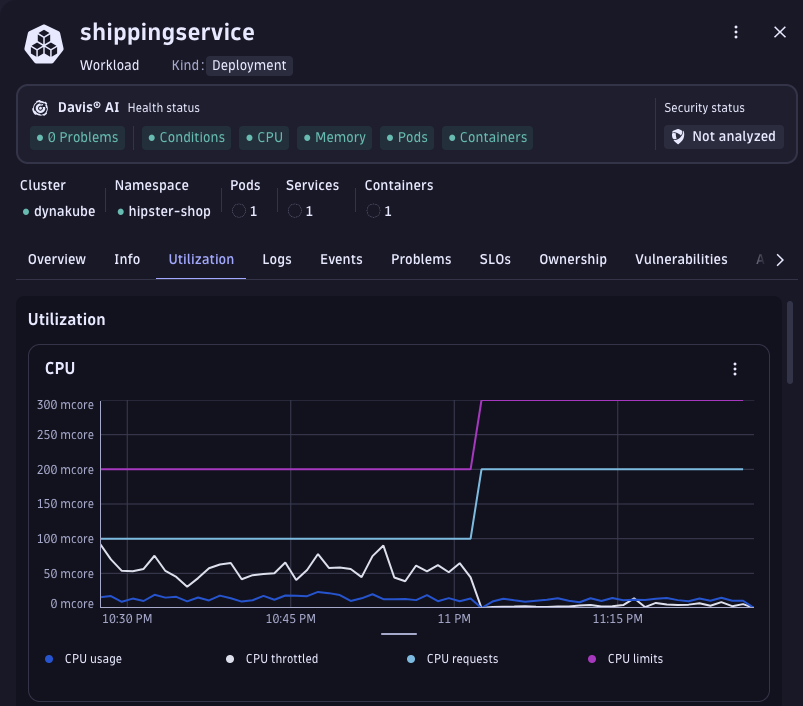
After making the changes, we see that CPU throttling has dropped significantly and Davis AI no longer detects any problem.
Comparison of Log Analytics in GCP and Dynatrace – Why Monitor GCP Applications on Dynatrace?
While GCP offers native monitoring and logging tools, there are several compelling reasons why adding Dynatrace to monitor your GCP applications can elevate your observability strategy. Dynatrace, as shown in this walkthrough, enables rapid detection and diagnosis of issues like CPU throttling, which leads to faster identification and resolution of resource constraints across your cloud environment.
In addition, Dynatrace’s unified platform brings a holistic view of logs and metrics in context, making troubleshooting more efficient and effective. Its advanced log analytics tools help consolidate and analyze data, providing a comprehensive perspective that improves overall visibility and observability.
Key Differences between GCP Logcs Analytics and Dynatrace Logs Analytics:
1. Storage Architecture
In GCP, log data is stored in project-specific log buckets. Viewing logs is limited to the logs within each bucket, although centralized logging across multiple projects is possible by aggregating logs into a single bucket. However, centralized buckets quickly approach or exceed storage quotas, risking throttling or data loss. Additionally, log buckets are region-specific, and moving or copying logs between regions is not natively supported.
Dynatrace’s Grail platform, in contrast, offers a unified data lakehouse that consolidates logs, metrics, traces, and events in a single repository. This setup eliminates data silos, simplifies data management, and enables richer insights by correlating logs with other observability data points. With a single source of truth for all observability data, troubleshooting becomes faster and more effective.
2. Schema vs Schemaless Log Parsing
GCP’s Cloud Logging follows a traditional schema-based model that require indexing data into rigid schemas before you can effectively parse your log data. Log entries in GCP have specific fields such as resource.type, severity, and timestamp and they are essential for constructing queries and performing analyses. However, they can limit flexibility, especially when logs have varied formats.
Dynatrace adopts a schemaless approach for log ingestion, dynamically parsing and analyzing data without enforcing fixed schema definitions. This parse-on-read functionality allows seamless integration of diverse log formats from GCP applications without extensive reconfiguration. It ensures that all log sources, even custom formats, are accommodated easily.
3. Ease of Querying with Query Language
GCP’s Logs Explorer uses the Google Logging Query Language (GLQL), a SQL-like syntax that offers SQL-style filtering, grouping, and sorting. For users who have a technical background or familiar with SQL, GLQL is similar, though its unique syntax and field structure may require a learning curve.
Dynatrace Query Language (DQL), by contrast, is designed to be simple yet powerful for both technical and business users. It supports flexible data grouping, filtering, and aggregation, making it straightforward to create complex queries that surface insights quickly. Dynatrace’s DQL offers enhanced usability through built-in templates, suggestions, and an intuitive syntax, making it easier for teams to maximize log data value. This user-friendly approach is especially beneficial for deep-diving into logs for troubleshooting and root cause analysis, allowing teams to uncover valuable insights with minimal effort.
I hope this comparison highlights the unique benefits Dynatrace can bring to your GCP environment. Thank you for reading my blog and I hope you found it helpful!

