Observability plays a crucial role in understanding, maintaining, and optimizing complex systems in the realm of Site Reliability Engineering (SRE). It enables SREs to gain deep insights into the internal workings of systems by analyzing outputs such as metrics, logs, and traces.
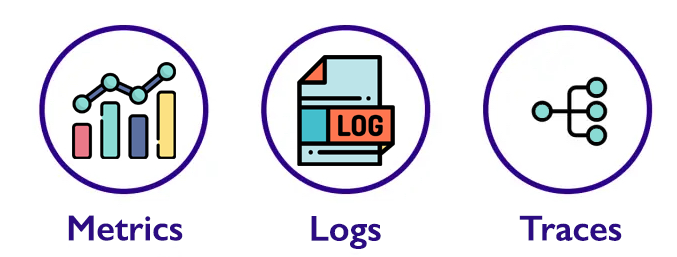
When it comes to distributed applications, it’s essential to ensure that you can observe all the moving parts to quickly diagnose and resolve issues. Observability is built on three key pillars: metrics, logs, and traces. In my previous post, I have created a RAG chatbot using AWS Bedrock knowledge base, in this post I will use the chatbot as an example to guide you through setting up tracing using AWS X-Ray.
The Three Pillars of Observability
1. Metrics
Metrics are numerical representations of system performance over time. These values provide insight into how a system is functioning and can be used to detect anomalies, forecast trends, and set thresholds for alerts. Metrics are typically aggregated over time, such as request latency, CPU usage, or error rates.
2. Logs
Logs capture detailed records of events, providing information about what happened at specific points in time. They offer a deep level of insight into the specific actions taken by services, users, and infrastructure. Logs are indispensable for debugging issues and tracing system behaviour.
3. Traces
Traces capture the end-to-end journey of a request through various services in a distributed system. In modern architectures such as microservices, tracing is essential for understanding how requests interact with different components and for pinpointing bottlenecks or failures.
AWS X-Ray enables distributed tracing by showing the lifecycle of requests across AWS services such as Lambda, API Gateway, SQS, OpenSearch, and more.
Tracing with AWS X-Ray: Why It’s Important
My chatbot involves multiple services like Lambda functions, API Gateway, SQS, OpenSearch, and Bedrock, and tracing helps monitor how queries from users traverse through these services. Tracing provides valuable insights into performance issues, error handling, and dependencies, allowing us to optimize the system and ensure reliability.
Key Benefits of Tracing:
- Latency Visualization: Identify slow components in a request lifecycle.
- Dependency Mapping: Understand how different services interact with each other.
- Error Diagnosis: Identify where and why requests are failing.
- End-to-End Monitoring: Track a request from API Gateway to Lambda, SQS, OpenSearch, and other services.
Setting Up AWS X-Ray and AWS Distro for OpenTelemetry Collector for Tracing
In this section, I’ll guide you through setting up tracing using AWS X-Ray and AWS Distro for OpenTelemetry (ADOT).
AWS Distro for OpenTelemetry (ADOT) is AWS-supported distribution of the Cloud Native Computing Foundation (CNCF) OpenTelemetry project. OpenTelemetry (OTel) provides open source APIs, libraries, and agents to collect logs, metrics, and traces.
With ADOT, you can instrument your applications once and send correlated logs, metrics, and traces to one or more observability backends such as Amazon Managed Service for Prometheus, Amazon CloudWatch, AWS X-Ray, Amazon Open Search, any OpenTelemetry Protocol (OTLP) compliant backend, as well as Amazon Managed Streaming for Apache Kafka (MSK).
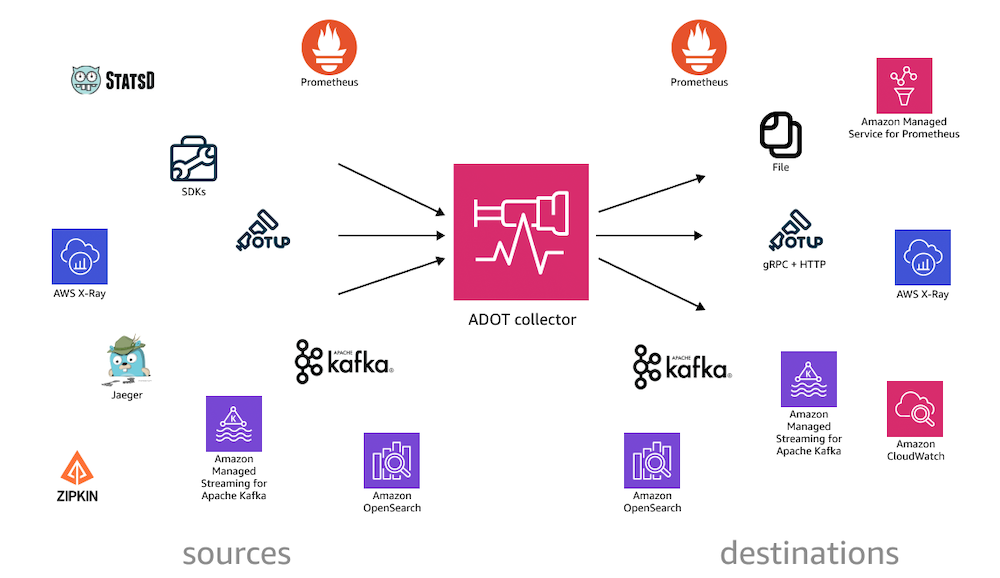
Step 1: Install ADOT Collector Using ECS
To collect telemetry data from the AWS environment, I’ll install the ADOT collector on ECS using ECS Task Definition. The ADOT collector can gather data such as metrics and traces from different AWS services and send them to AWS X-Ray.
a. Create new IAM Policy – AWSDistroOpenTelemetryPolicy
Create a new IAM Policy name AWSDistroOpenTelemetryPolicy with the following policy:
{
    "Version": "2012-10-17",
    "Statement": [
        {
            "Effect": "Allow",
            "Action": [
                "logs:PutLogEvents",
                "logs:CreateLogGroup",
                "logs:CreateLogStream",
                "logs:DescribeLogStreams",
                "logs:DescribeLogGroups",
                "logs:PutRetentionPolicy",
                "xray:PutTraceSegments",
                "xray:PutTelemetryRecords",
                "xray:GetSamplingRules",
                "xray:GetSamplingTargets",
                "xray:GetSamplingStatisticSummaries",
                "cloudwatch:PutMetricData",
                "ec2:DescribeVolumes",
                "ec2:DescribeTags",
                "ssm:GetParameters"
            ],
            "Resource": "*"
        }
    ]
}
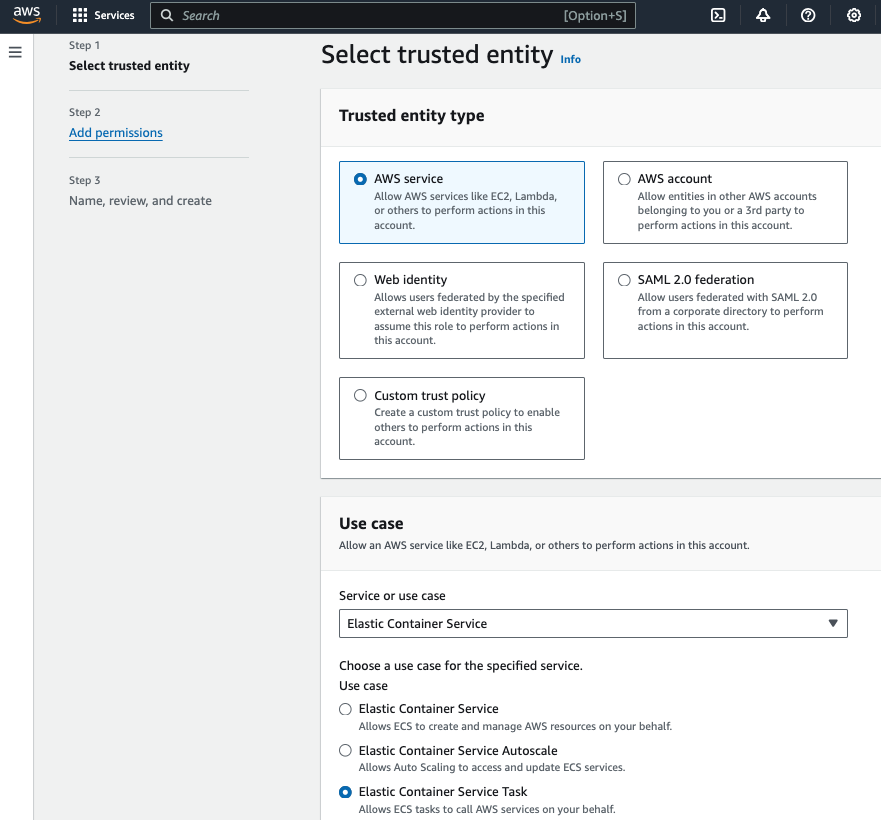
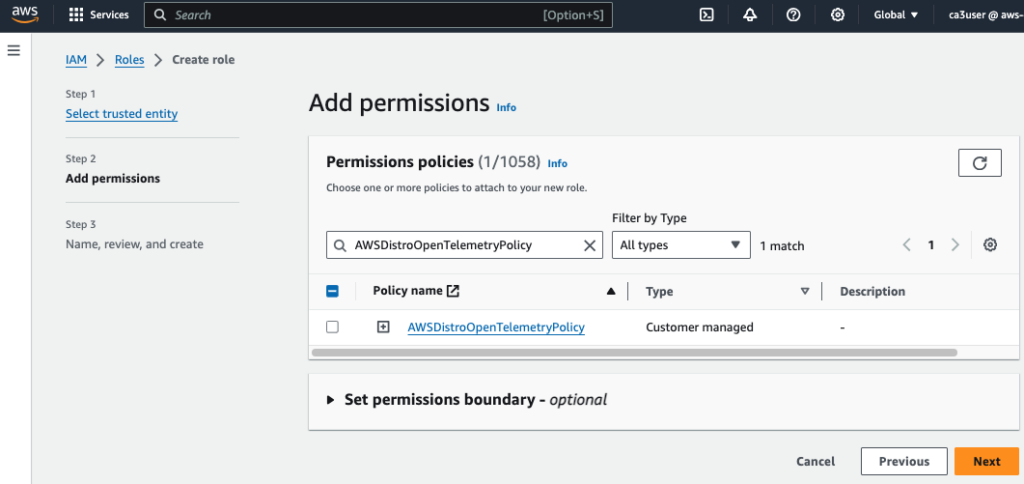
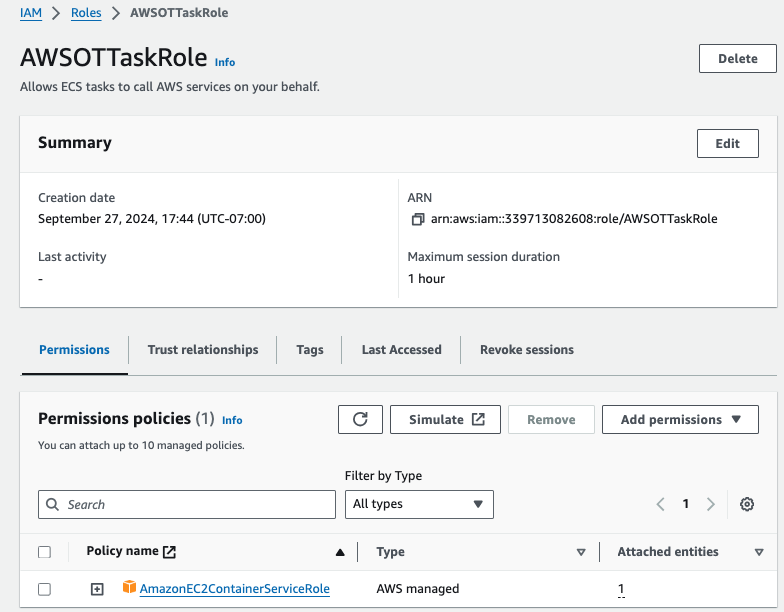
b. Create new IAM Role – AWSOTTaskRole
Create a new IAM Role name AWSOTTaskRole for running the ADOT Collector in a ECS task, and attach the newly created policy AWSDistroOpenTelemetryPolicy to it.
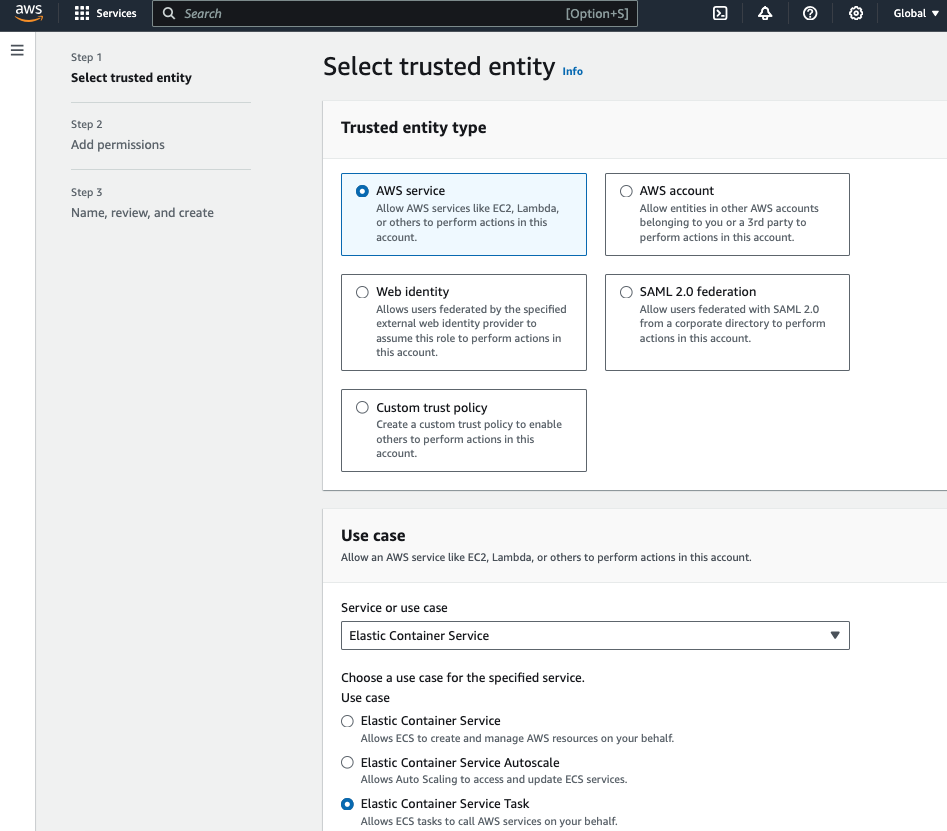
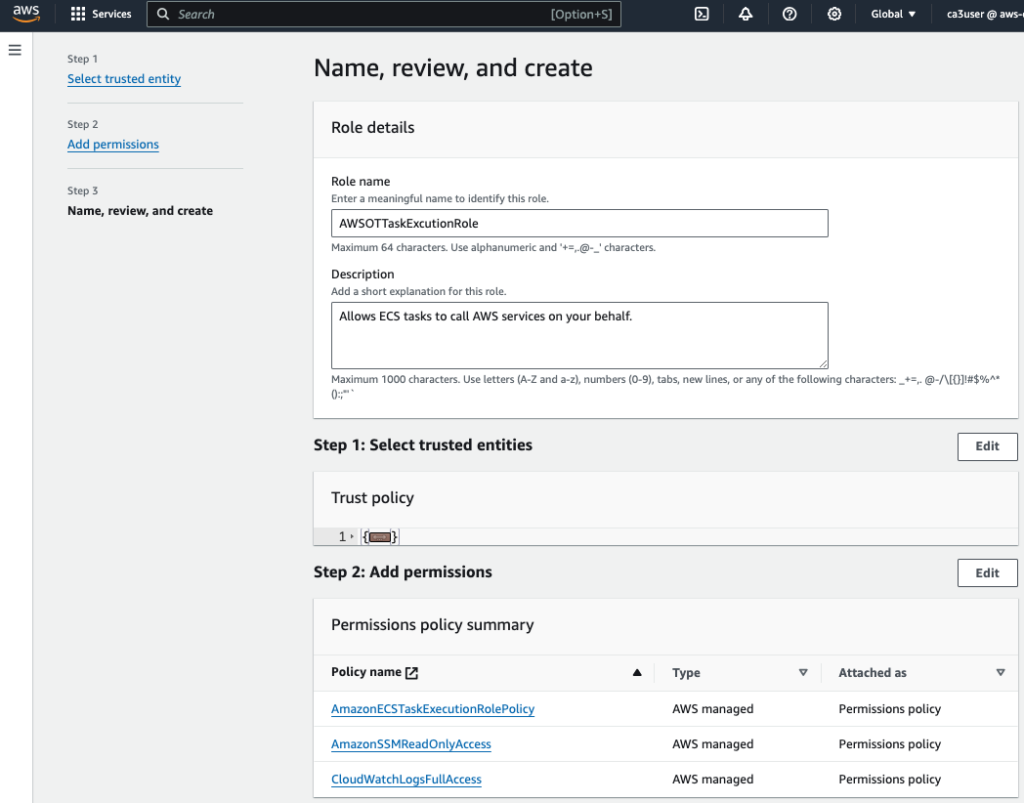
c. Create new IAM Role – TaskExecutionRole
Create a new IAM Role name TaskExecutionRole to grant ECS permission to make AWS API calls, and attach these 3 polices:
- AmazonECSTaskExecutionRolePolicy
- CloudWatchLogsFullAccess
- AmazonSSMReadOnlyAccess
d. Create new ECS Cluster
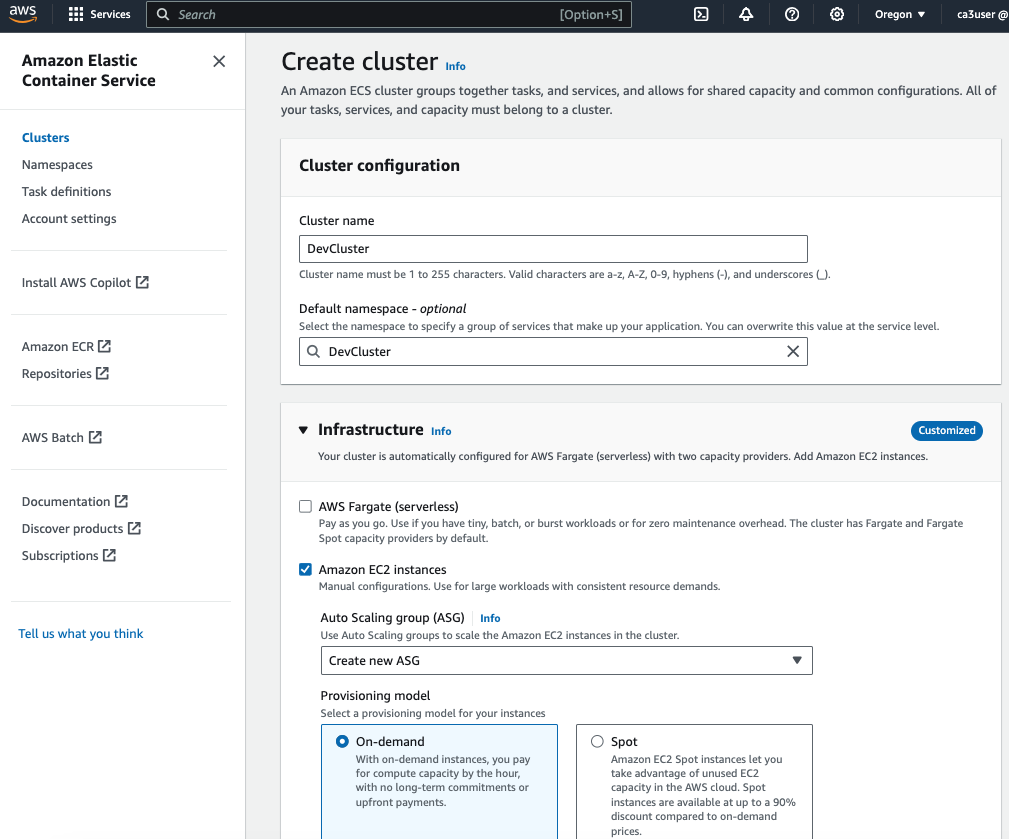
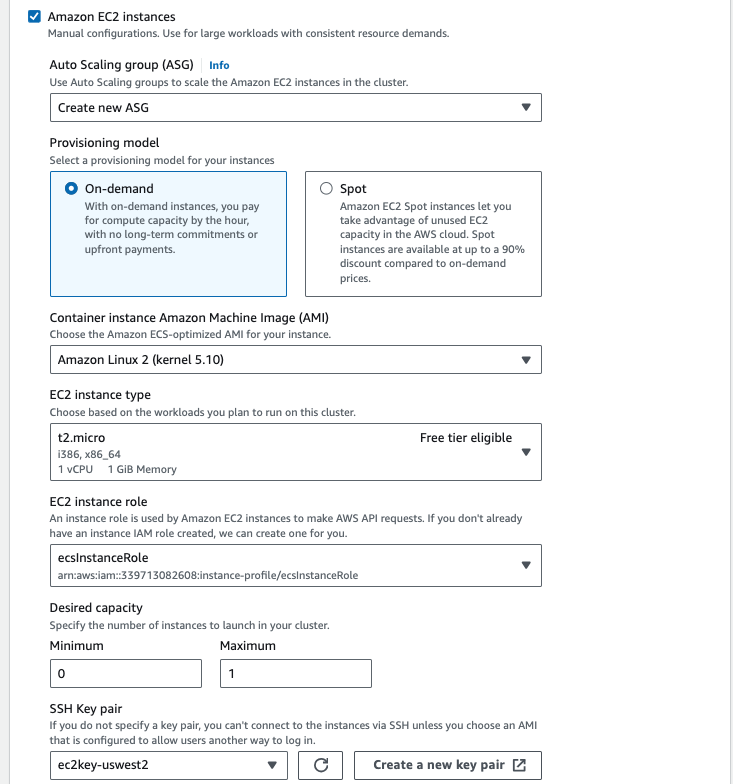
Open the Amazon ECS Console, choose Create Cluster and select EC2 Linux (for EC2-backed tasks) to create a ECS cluster.
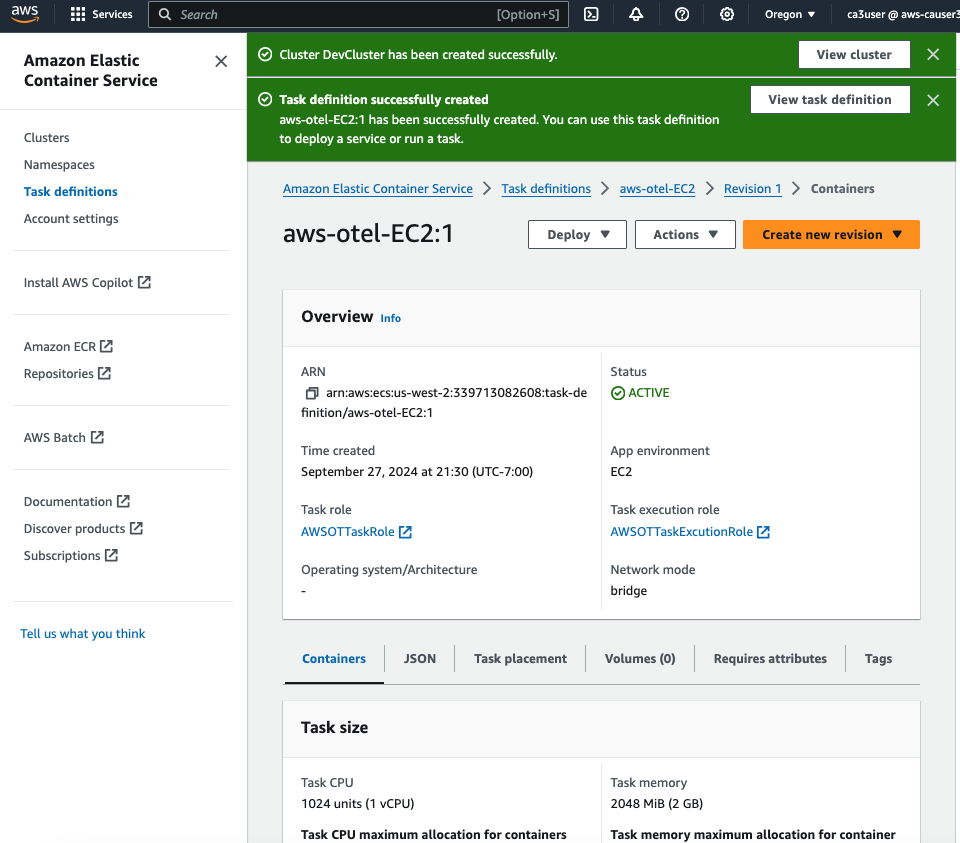
e. Create new ECS Task for the ADOT Collector
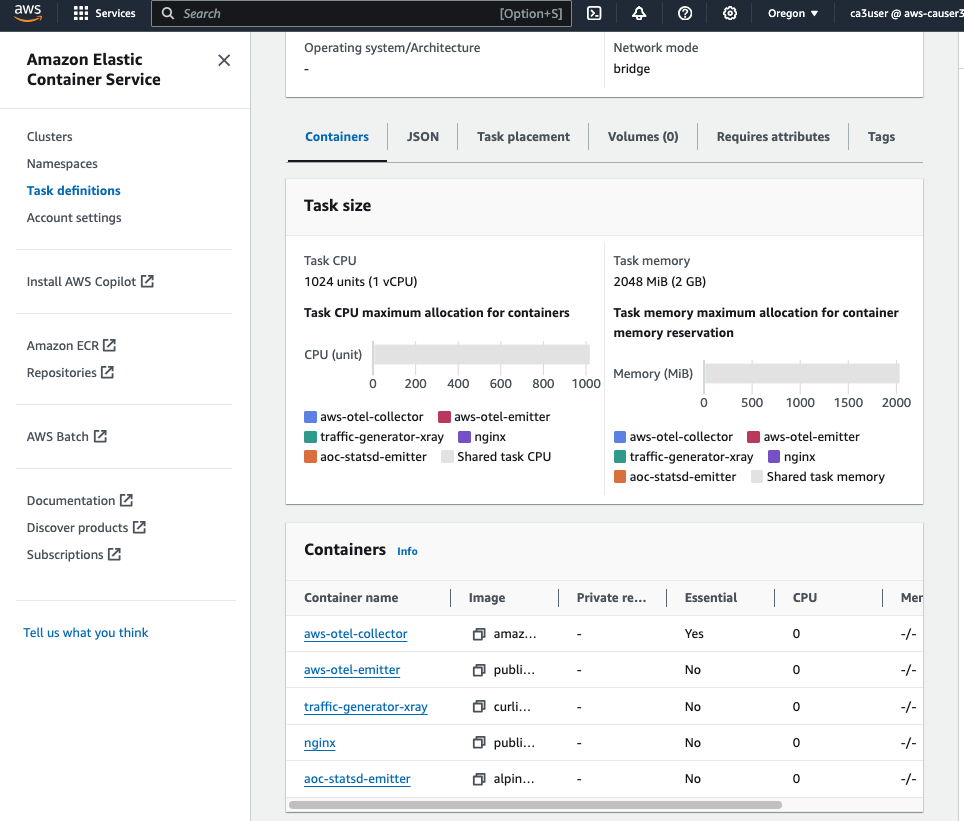
After the ECS cluster is created, go to Task definitions in ECS console to create a new ECS task. I will use a task definition template (ecs-ec2-sidecar.json) downloaded from GitHub
Update the following parameters in the task definition template:
- {{region}} – the region the data will be sent to (e.g. us-west-2)
- {{ecsTaskRoleArn}} – AWSOTTaskRole ARN created in the previous section
- {{ecsExecutionRoleArn}} – AWSOTTaskExcutionRole ARN created in the previous section
- command – Assign value to the command variable to select the config file path; i.e. –config=/etc/ecs/ecs-default-config.yaml
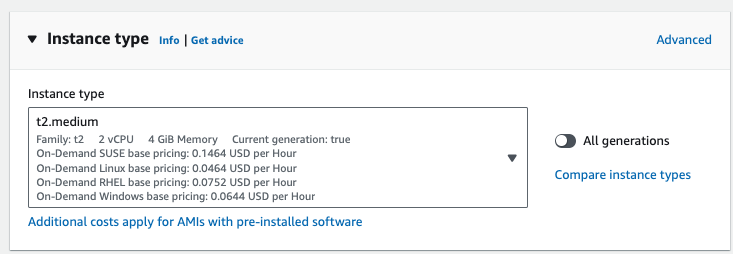
The task requires 1 vCPU and 2GB memory, make sure the EC2 instance type in your AutoScaling Group launch template meet this requirement. Here my ASG is using the t2.medium instance type with 2 vCPU and 4GB memory.
Once the task definition is created, deploy the task to your ECS cluster.
Step 2: Set Up Tracing for Lambda Functions
After setting up the ADOT collector, let’s move on to tracing your Lambda functions.
ADOT support auto-instrumention for Lambda function by packaging OpenTelemetry together with an out-of-the-box configuration for AWS Lambda and AWS X-Ray as a Lambda layer. Therefore we can enable OpenTelemetry for our Lambda function without changing any code.
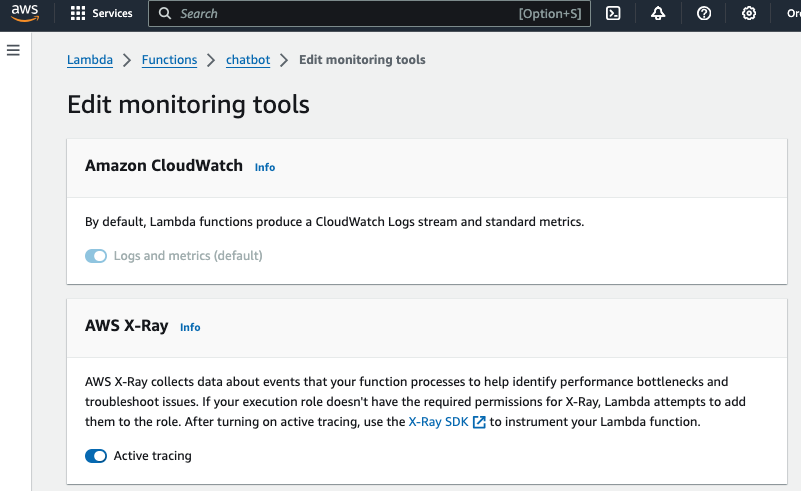
a. Enable Active Tracing on Your Lambda Function
- Open the AWS Lambda Console.
- Select your Lambda function.
- Under Monitoring and Operations Tools, enable Active Tracing. This will send trace data to AWS X-Ray for every Lambda invocation.
b. Attach the ADOT Lambda Layer
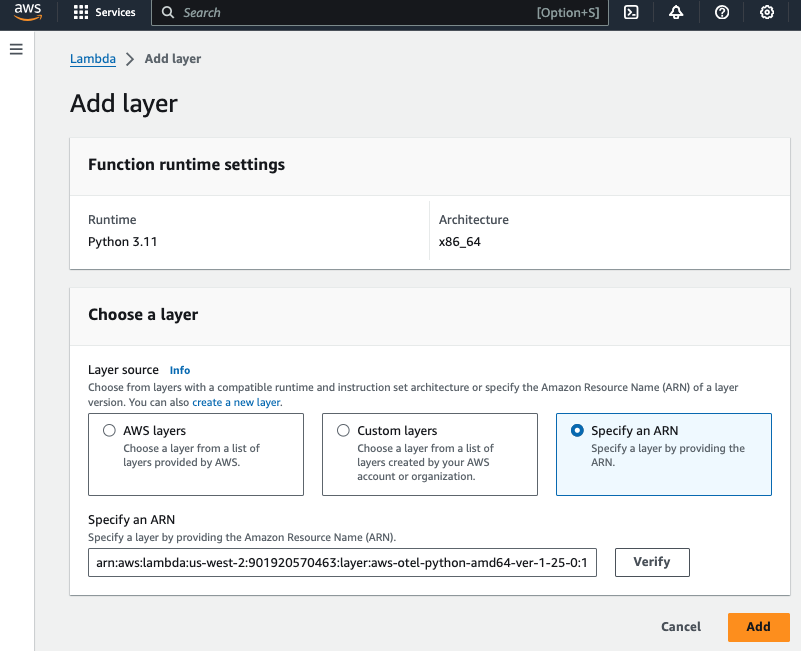
To instrument the Lambda function with OpenTelemetry, We will attach a reduced version of the AWS Distro for OpenTelemetry (ADOT) Lambda layer for use with your lambda function.
- In the AWS Lambda Console, go to your Lambda function.
- Under Layers, click Add a Layer.
- Choose Specify an ARN and enter the following ARN for ADOT:
arn:aws:lambda:us-west-2:901920570463:layer:aws-otel-python-amd64-ver-1-25-0:1- Deploy your Lambda function.
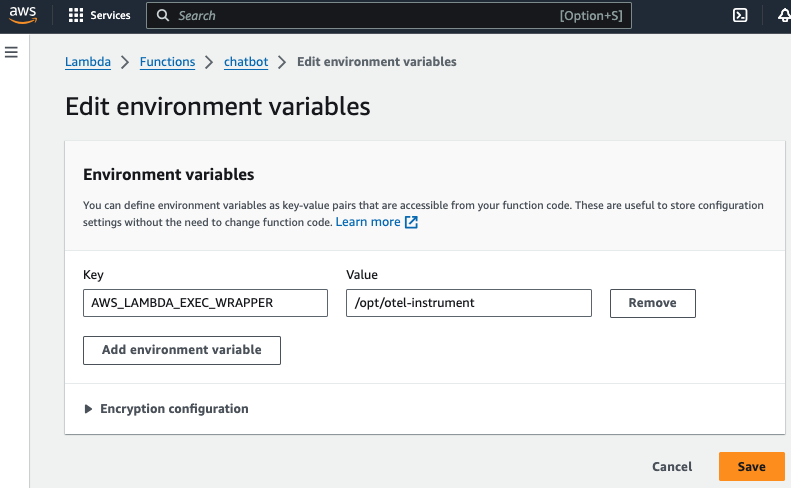
c. Add Lambda Environment Variable
Add the environment variable AWS_LAMBDA_EXEC_WRAPPER and set it to /opt/otel-instrument
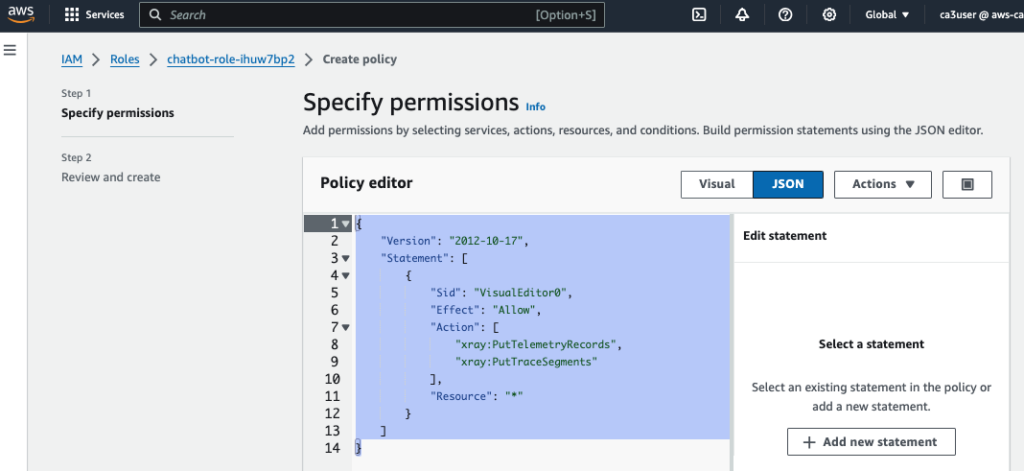
d. Add Lambda Execution Role Permission
Lambda needs the following permissions to send trace data to X-Ray. Add them to your lambda function’s execution role:
{
	"Version": "2012-10-17",
	"Statement": [
		{
			"Sid": "VisualEditor0",
			"Effect": "Allow",
			"Action": [
				"xray:PutTelemetryRecords",
				"xray:PutTraceSegments"
			],
			"Resource": "*"
		}
	]
}
Step 3: Set Up Tracing for API Gateway
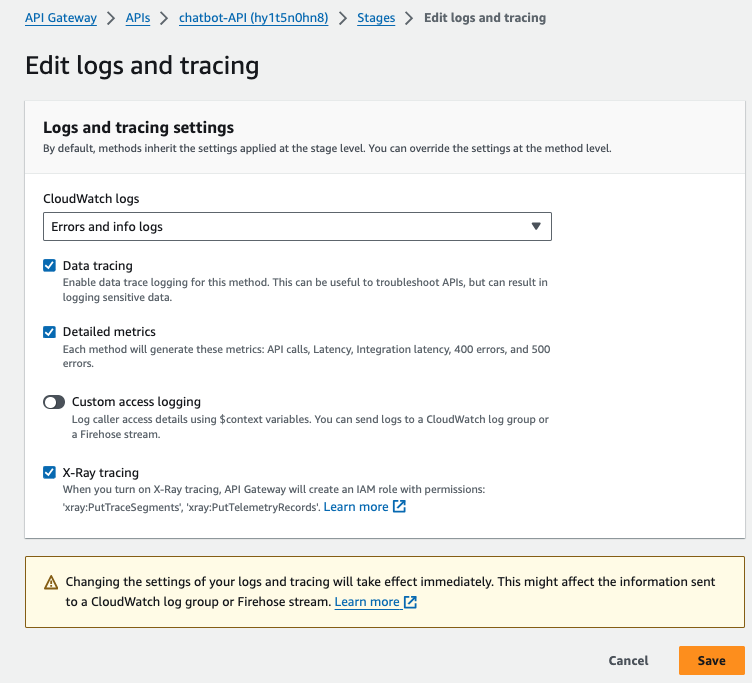
API Gateway is often the entry point for requests to your Lambda functions. To trace requests passing through API Gateway, follow these steps:
- Enable X-Ray on API Gateway:
- Open the API Gateway Console.
- Select your API.
- In the Stages section, edit Logs and tracing and check the box to enable X-Ray Tracing.
- Deploy API Gateway:
- After enabling X-Ray, deploy your API changes.
- This will send traces for incoming requests from API Gateway to Lambda, allowing you to trace the complete request lifecycle.
Step 4: SQS and X-Ray Tracing
Amazon SQS integrates with AWS X-Ray to propagate tracing headers, allowing trace continuity from the sender to the consumer. When a message is sent to SQS using the AWS SDK, the X-Amzn-Trace-Id is automatically attached. This enables trace context propagation, which can be carried through to the consumer Lambda function, allowing you to track the message’s journey through the system.
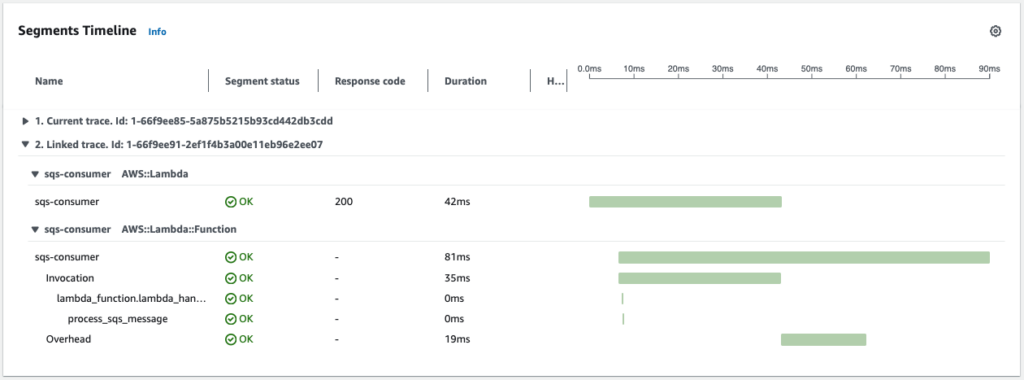
To illustrate this auto-propagation, I modified my chatbot lambda function to send a message to SQS message queue everytime when there is a enquiry. Then I create another lambda function to consume the message and we’ll see how these two traces (i.e. from producer lambda to consumer lambda) are linked together.

Step 5: Visualize Traces in AWS X-Ray
Once everything is set up, you can visualize your traces in AWS X-Ray:
- Open the AWS X-Ray Console from the AWS Management Console.
- Navigate to the Service Map to view the interactions between API Gateway, Lambda, SQS, OpenSearch, and Bedrock.
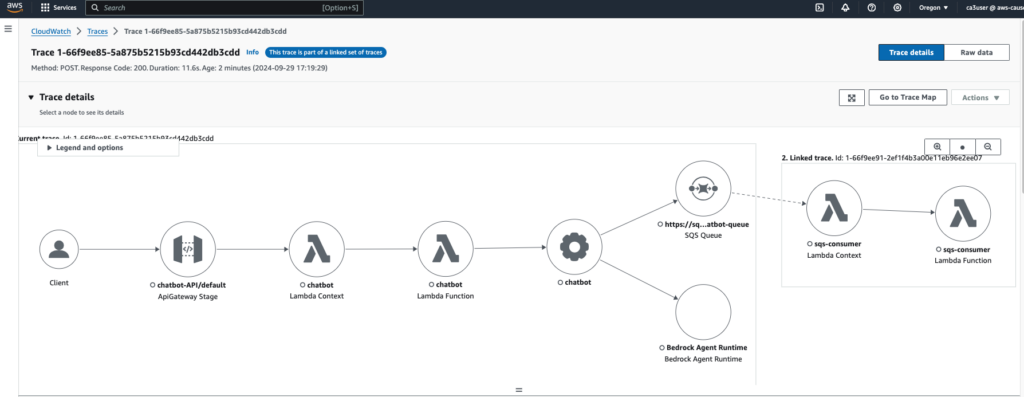
In this chatbot use case, you can see a client interacts with the chatbot interface through an API call, which makes a lambda function call to a Bedrock Agent to generate responses. You can see in the map below that there is a linked trace after the SQS queue that shows my lambda function (sqs-consumer) consumes the message. This propagation is done automatically by SQS without the need to inject any trace header.
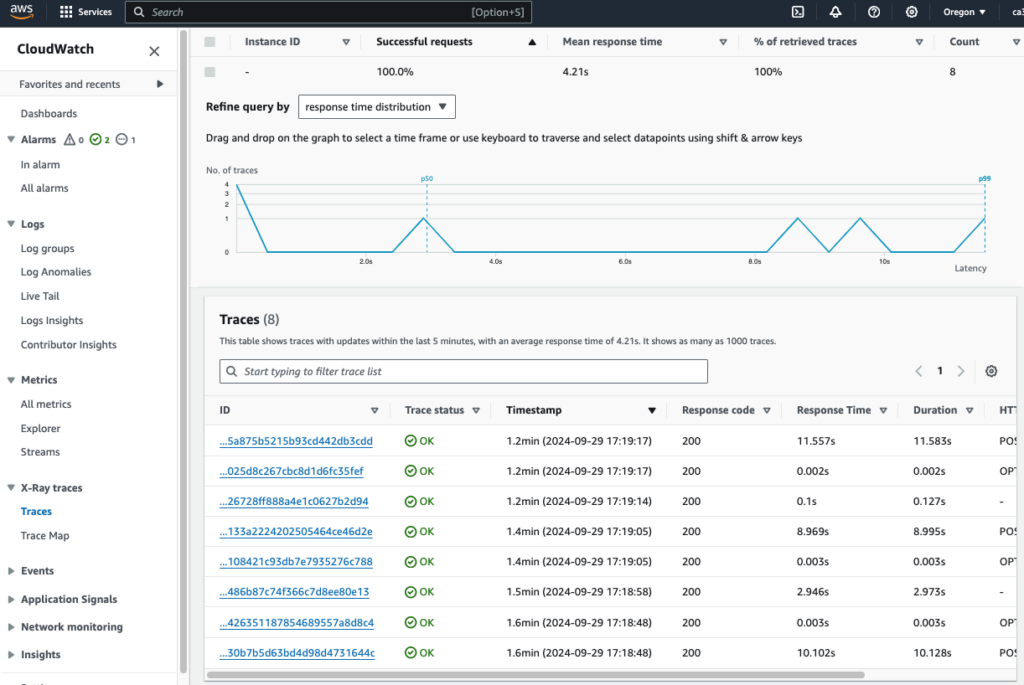
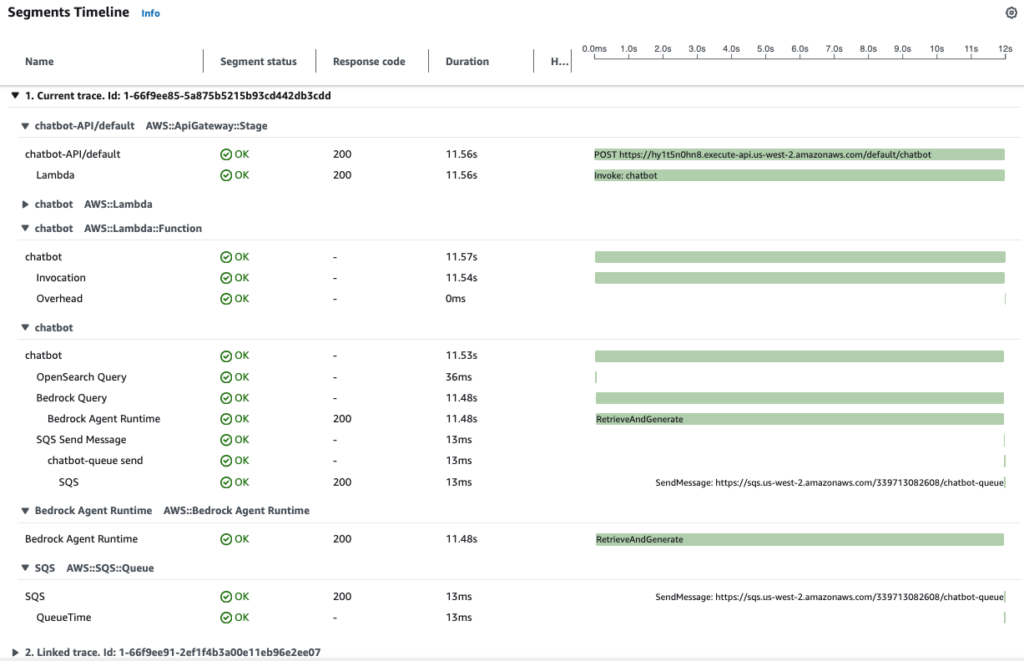
Click on individual traces to drill down into the specific operations, latency, and any errors that occurred through the point at which the chatbot API is called all the way to the end of the request. We can see a waterfall style diagram of all the different elements involved during the call and how long it took for each of them to call and retrieve a result.
Step 6: Debugging with Tracing
When a system issue arises, you can use AWS X-Ray to track the problem through the entire system by examining each trace segment for anomalies.
1. Simulate a Failure Scenario
Let’s simulate a failure by deliberately breaking the Lambda function that queries OpenSearch. I modify my chatbot lambda function query_opensearch() to introduce an error:
def query_opensearch(query_text):
    # Simulate a failure by introducing an invalid operation
    raise Exception("Simulated failure in OpenSearch query")
This deliberate failure causes the function to break whenever it attempts to query OpenSearch.
2. View the Trace in AWS X-Ray
Now that I’ve broken the function, invoke the Lambda function by sending a query through my chatbot. Then, follow these steps to trace the failure in AWS X-Ray:
- Step 1: Go to the AWS X-Ray Console and open the Service Map.
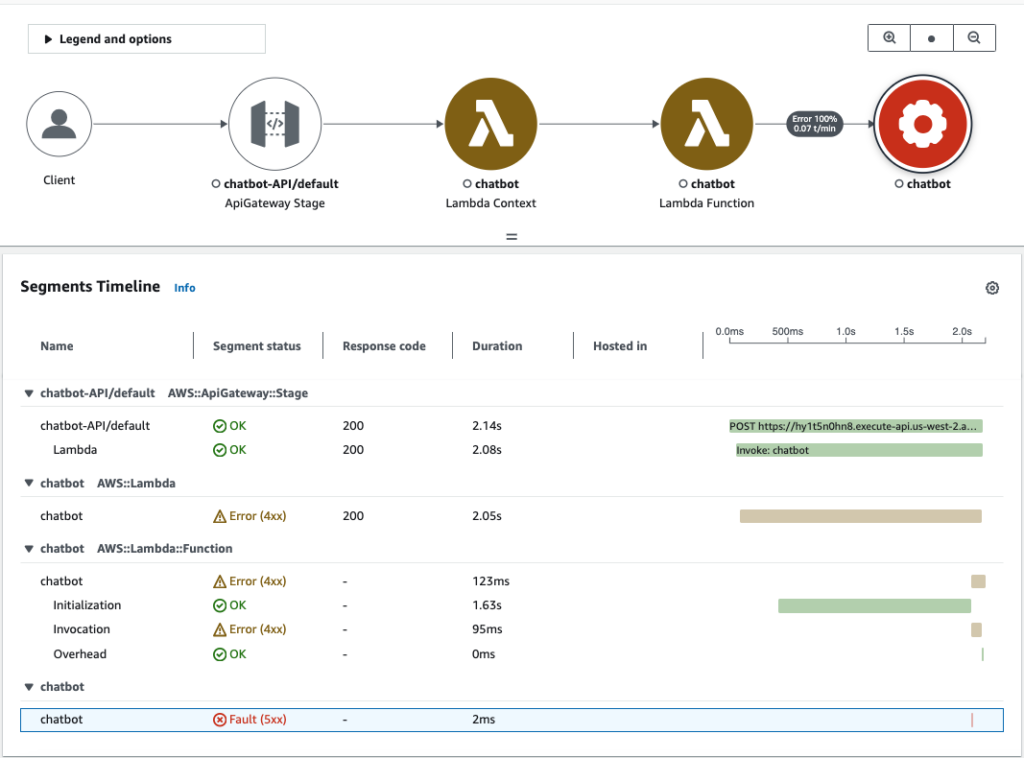
- Step 2: Locate the chatbot node that shows in red.
- Step 3: Click on the chatbot node to view detailed trace data, including the failure point and the error messages.
In the Trace Map, you’ll see a visual representation of how the request flowed from API Gateway, through Lambda, to SQS, and to OpenSearch. Each segment will be color-coded to indicate success, failure, or latency issues. The chatbot function is in red now, indicating that this node is causing the error.
3. Trace Logs and Debugging
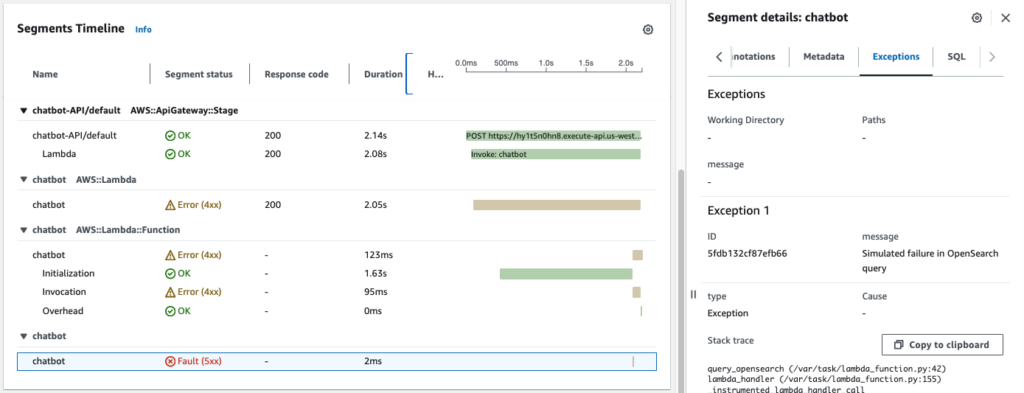
X-Ray Trace Detail: Within the trace detail, you’ll see the exact point where the error occurred, allowing you to pinpoint which service or code segment caused the issue. In our case, the chatbot function is causing the 500 fault code and when we examine the segment in details, we see in the exceptions that the error message is "Simulated failure in OpenSearch query". You can see how useful X-Ray is in helping you debug your application.
Limitations of AWS X-Ray
While AWS X-Ray supports many services, including Lambda, API Gateway, SQS, SNS, S3, etc., there are still limitations with some services like Kinesis and DynamoDB Streams, where manual instrumentation is required for full traceability. For services without native X-Ray support, you can propagate trace headers across the service calls by manually instrument the service to ensure consistent visibility across your architecture.
For unsupported services, like DynamoDB Streams or custom HTTP requests, you can manually use ADOT to create and propagate trace context. Below is an example of using OpenTelemetry with AWS X-Ray for tracing a DynamoDB operation:
from opentelemetry import trace
import boto3

# Initialize ADOT X-Ray tracing
tracer = trace.get_tracer(__name__)

# Instrument boto3 for tracing
BotocoreInstrumentor().instrument()

# Manually instrumenting DynamoDB request with tracing
with tracer.start_as_current_span("DynamoDB Operation"):
    dynamodb_client = boto3.client('dynamodb')
    dynamodb_client.put_item(TableName="MyTable", Item={"Key": {"S": "value"}})
Other Limitation of AWS X-Ray – Sampling Rate
AWS X-Ray uses sampling to limit the amount of data collected and processed to reduce cost and performance overhead. That means it might not capture every request, particularly in high-traffic environments. To mitigate or overcome this limitation, there are several strategies you can use:
Create Custom Sampling Rules: AWS X-Ray allows you to define custom sampling rules to control how often traces are collected based on specific criteria, such as the request path, service name, or resource ARN. This gives you fine-grained control over which requests to sample more frequently.
- Increase Sampling for Critical Requests: You can configure a higher sampling rate for critical services or API paths (e.g.,
/payment,/checkout, or API Gateway stages) while reducing the sampling rate for less important or high-traffic requests. - Reduce Sampling for Routine Operations: Set lower sampling rates for common, non-critical requests, like health checks or static asset requests, to reduce unnecessary traces.
This ensures critical parts of your system are always traced, while non-essential requests have reduced sampling.
Conclusion
In this post, I’ve explored one of three pillars of observability—traces and demonstrated how to set up AWS X-Ray and AWS Distro for OpenTelemetry (ADOT) for tracing in an distributed application. By following these steps, you can gain deep insights into the performance and behaviour of your distributed services, quickly identify and troubleshoot issues, and optimize its reliability.
Thank you for reading my blog and I hope you like it!

